Energy
Where are Clean Energy Technologies Manufactured?
![]() Subscribe to the Elements free mailing list for more like this
Subscribe to the Elements free mailing list for more like this


Visualizing Where Clean Energy Technologies Are Manufactured
This was originally posted on Elements. Sign up to the free mailing list to get beautiful visualizations on natural resource megatrends in your email every week.
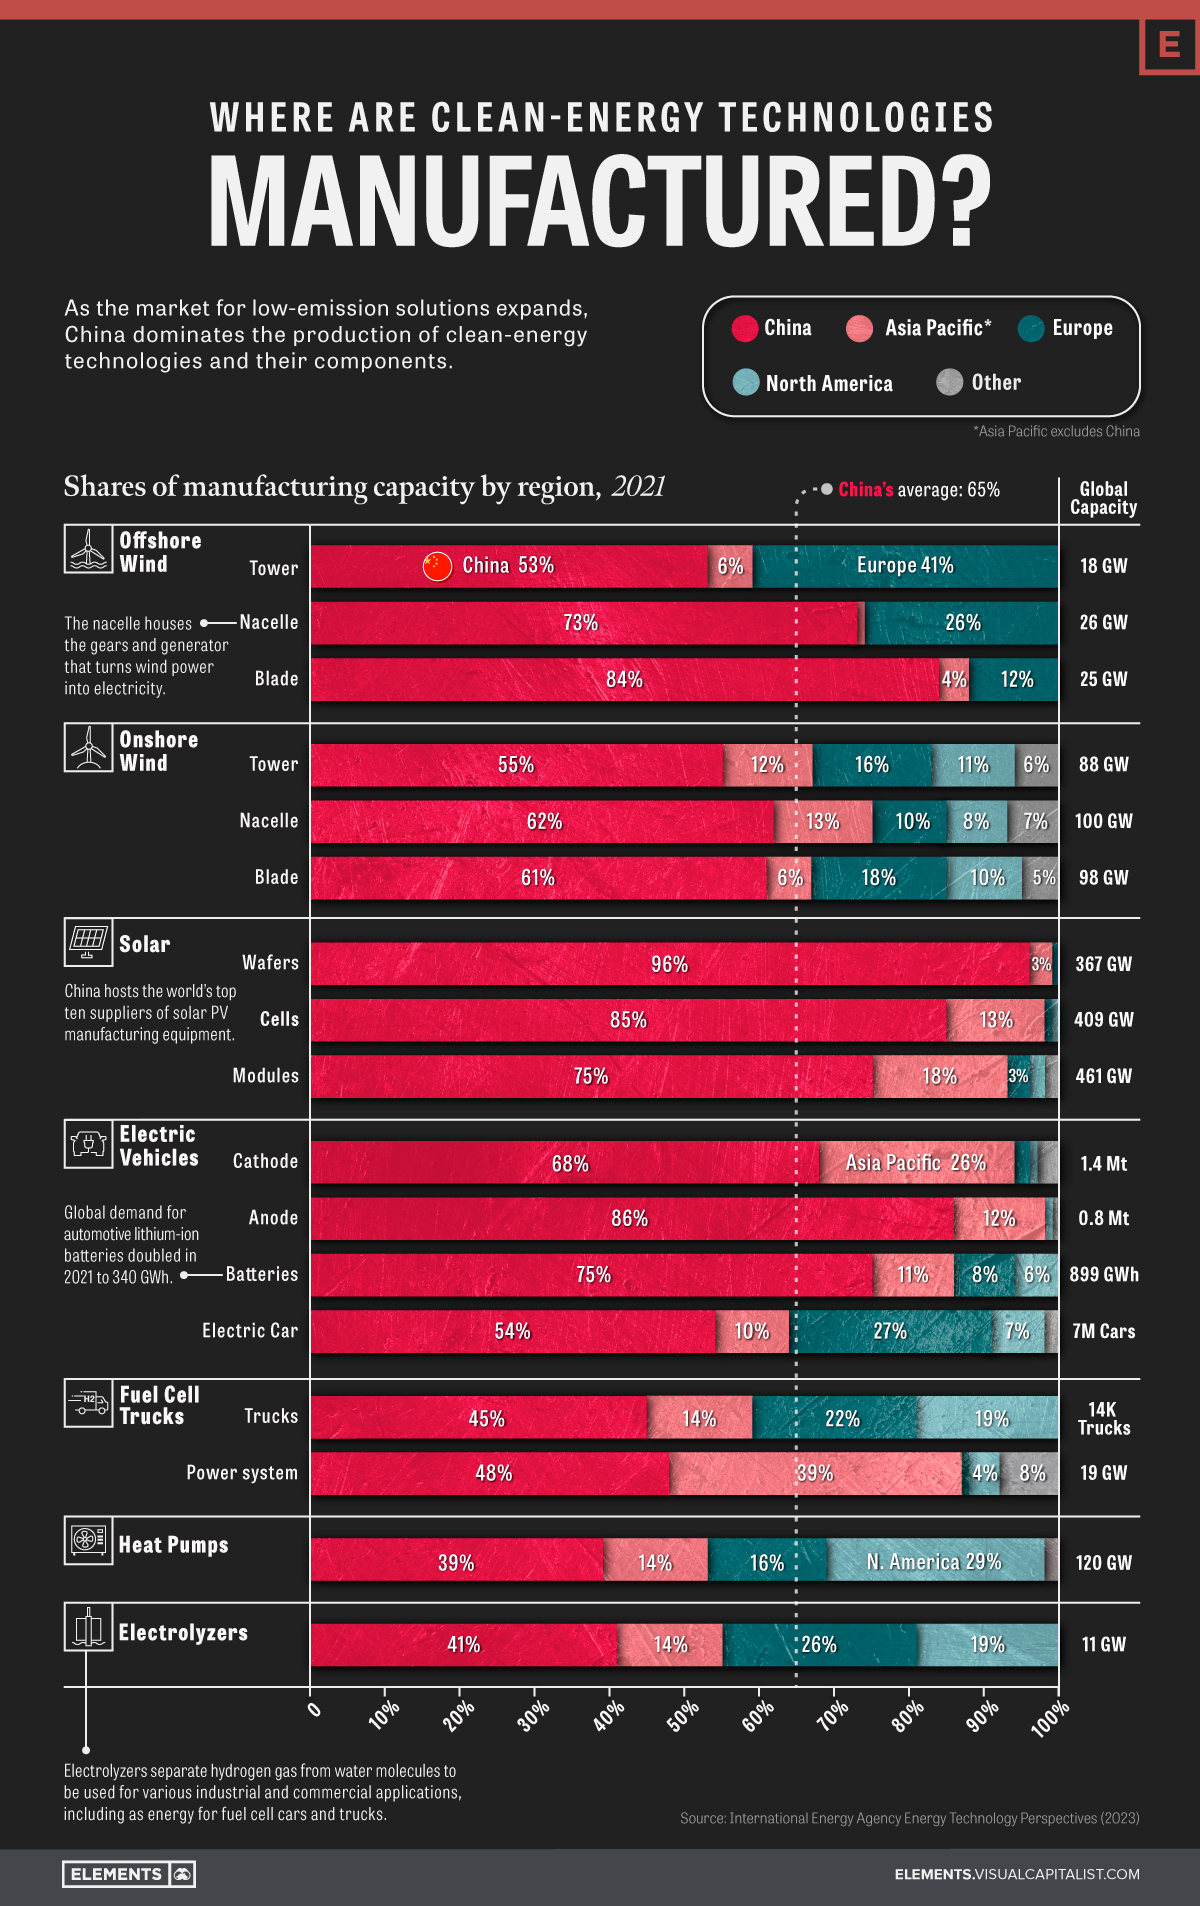
When looking at where clean energy technologies and their components are made, one thing is very clear: China dominates the industry.
The country, along with the rest of the Asia Pacific region, accounts for approximately 75% of global manufacturing capacity across seven clean energy technologies.
Based on the IEA’s 2023 Energy Technology Perspectives report, the visualization above breaks down global manufacturing capacity by region for mass-manufactured clean energy technologies, including onshore and offshore wind, solar photovoltaic (PV) systems, electric vehicles (EVs), fuel cell trucks, heat pumps, and electrolyzers.
The State of Global Manufacturing Capacity
Manufacturing capacity refers to the maximum amount of goods or products a facility can produce within a specific period. It is determined by several factors, including:
- The size of the manufacturing facility
- The number of machines or production lines available
- The skill level of the workforce
- The availability of raw materials
According to the IEA, the global manufacturing capacity for clean energy technologies may periodically exceed short-term production needs. Currently, this is true especially for EV batteries, fuel cell trucks, and electrolyzers. For example, while only 900 fuel cell trucks were sold globally in 2021, the aggregate self-reported capacity by manufacturers was 14,000 trucks.
With that said, there still needs to be a significant increase in manufacturing capacity in the coming decades if demand aligns with the IEA’s 2050 net-zero emissions scenario. Such developments require investments in new equipment and technology, developing the clean energy workforce, access to raw and refined materials, and optimizing production processes to improve efficiency.
What Gives China the Advantage?
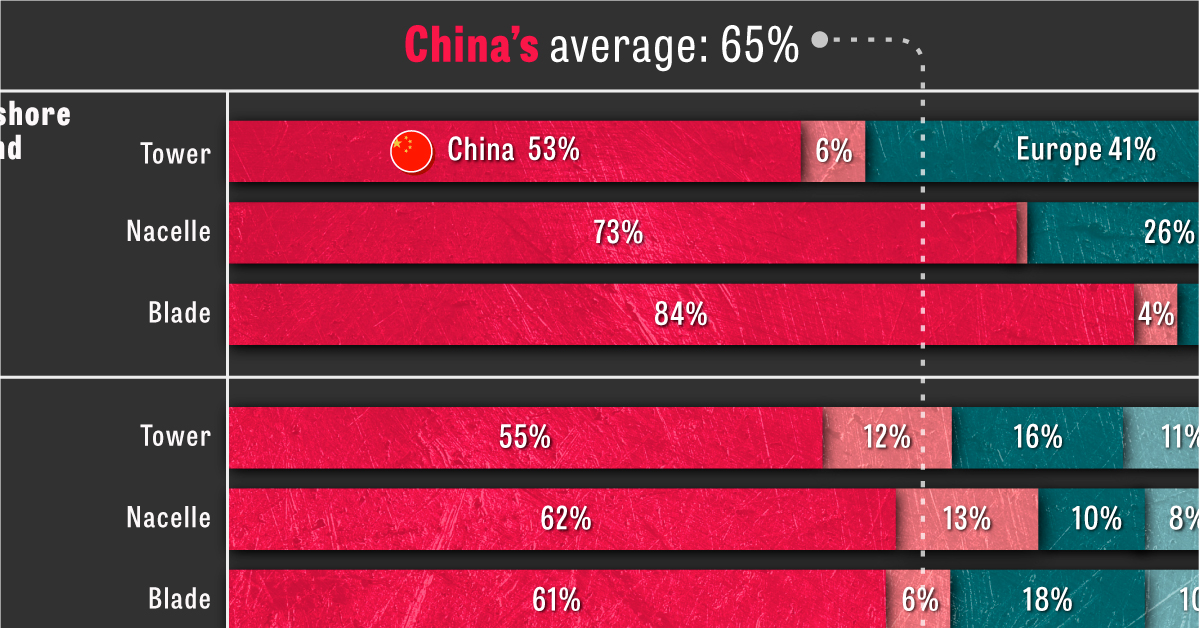
Of the above clean energy technologies and their components, China averages 65% of global manufacturing capacity. For certain components, like solar PV wafers, this percentage is as high as 96%.
Here’s a breakdown of China’s manufacturing capacity per clean energy technology.
| Technology | China’s share of global manufacturing capacity, 2021 |
|---|---|
| Wind (Offshore) | 70% |
| Wind (Onshore) | 59% |
| Solar PV Systems | 85% |
| Electric Vehicles | 71% |
| Fuel Cell Trucks | 47% |
| Heat Pumps | 39% |
| Electrolyzers | 41% |
So, what gives China this advantage in the clean energy technology sector? According to the IEA report, the answer lies in a combination of factors:
- Low manufacturing costs
- A dominance in clean energy metal processing, namely cobalt, lithium, and rare earth metals
- Sustained policy support and investment
The mixture of these factors has allowed China to capture a significant share of the global market for clean technologies while driving down the cost of clean energy worldwide.
As the market for low-emission solutions expands, China’s dominance in the sector will likely continue in the coming years and have notable implications for the global energy and emission landscape.


Who’s Building the Most Solar Energy?
This was originally posted on our Voronoi app. Download the app for free on iOS or Android and discover incredible data-driven charts from a variety of trusted sources.
In 2023, solar energy accounted for three-quarters of renewable capacity additions worldwide. Most of this growth occurred in Asia, the EU, and the U.S., continuing a trend observed over the past decade.
In this graphic, we illustrate the rise in installed solar photovoltaic (PV) capacity in China, the EU, and the U.S. between 2010 and 2022, measured in gigawatts (GW). Bruegel compiled the data..
Chinese Dominance
As of 2022, China’s total installed capacity stands at 393 GW, nearly double that of the EU’s 205 GW and surpassing the USA’s total of 113 GW by more than threefold in absolute terms.
| Installed solar capacity (GW) | China | EU27 | U.S. |
|---|---|---|---|
| 2022 | 393.0 | 205.5 | 113.0 |
| 2021 | 307.0 | 162.7 | 95.4 |
| 2020 | 254.0 | 136.9 | 76.4 |
| 2019 | 205.0 | 120.1 | 61.6 |
| 2018 | 175.3 | 104.0 | 52.0 |
| 2017 | 130.8 | 96.2 | 43.8 |
| 2016 | 77.8 | 91.5 | 35.4 |
| 2015 | 43.6 | 87.7 | 24.2 |
| 2014 | 28.4 | 83.6 | 18.1 |
| 2013 | 17.8 | 79.7 | 13.3 |
| 2012 | 6.7 | 71.1 | 8.6 |
| 2011 | 3.1 | 53.3 | 5.6 |
| 2010 | 1.0 | 30.6 | 3.4 |
Since 2017, China has shown a compound annual growth rate (CAGR) of approximately 25% in installed PV capacity, while the USA has seen a CAGR of 21%, and the EU of 16%.
Additionally, China dominates the production of solar power components, currently controlling around 80% of the world’s solar panel supply chain.
In 2022, China’s solar industry employed 2.76 million individuals, with manufacturing roles representing approximately 1.8 million and the remaining 918,000 jobs in construction, installation, and operations and maintenance.
The EU industry employed 648,000 individuals, while the U.S. reached 264,000 jobs.
According to the IEA, China accounts for almost 60% of new renewable capacity expected to become operational globally by 2028.
Despite the phasing out of national subsidies in 2020 and 2021, deployment of solar PV in China is accelerating. The country is expected to reach its national 2030 target for wind and solar PV installations in 2024, six years ahead of schedule.

-

 Markets6 days ago
Visualized: Interest Rate Forecasts for Advanced Economies
-

 Markets2 weeks ago
Economic Growth Forecasts for G7 and BRICS Countries in 2024
-

 Wealth2 weeks ago
Charted: Which City Has the Most Billionaires in 2024?
-

 Technology2 weeks ago
All of the Grants Given by the U.S. CHIPS Act
-

 Green2 weeks ago
The Carbon Footprint of Major Travel Methods
-

 United States1 week ago
Visualizing the Most Common Pets in the U.S.
-

 Culture1 week ago
The World’s Top Media Franchises by All-Time Revenue
-

 voronoi1 week ago
Best Visualizations of April on the Voronoi App