Ocean Temperatures: Climate Warning for New England
January 26, 2022
Share
New England’s historical and cultural identity is inextricably linked to the ocean that laps at nearly 6,200 miles of coastline. And the region’s ocean waters are warming, and not just a little.
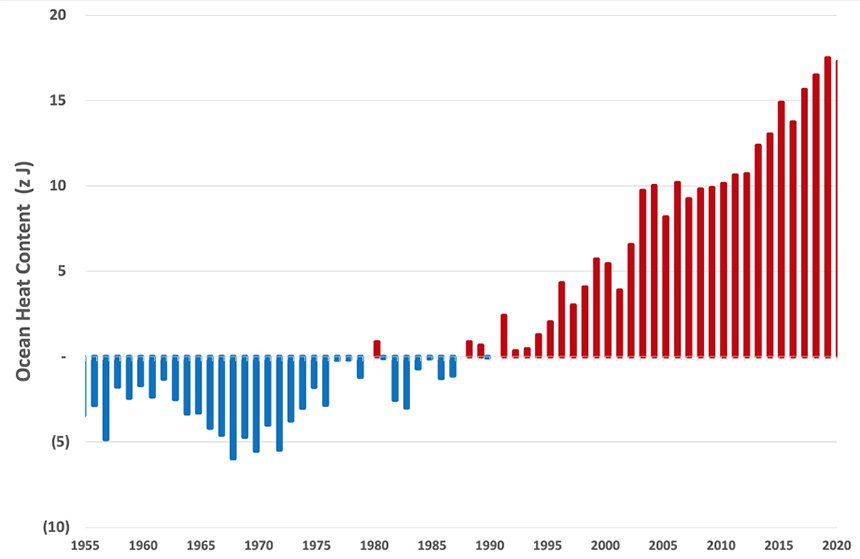
The above chart shows just how much the ocean has warmed over the past 65 years and, due to the accumulation of greenhouse gases, the heat dumped into the ocean has doubled since 1993. It is even more concerning that ocean warming has accelerated since 2010.
The world’s oceans, in 2021, were the hottest ever recorded by humans.
The findings of the data from the National Centers for Environmental Information (NCEI), which is part of the National Oceanic and Atmospheric Administration (NOAA), have been confirmed by Australia’s Commonwealth Scientific and Industrial Research Organization, China’s Institute of Atmospheric Physics, and the Japan Meteorological Agency’s Meteorological Research Institute.
The news for New England is worse, as the ocean here is heating up faster than that of the rest of the world.
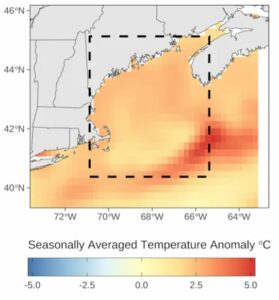
The Gulf of Maine Research Institute announced that between September and November of last year, the warmth of inlet waters adjacent to Maine and northern Massachusetts was the highest on record.
“This year [the Gulf of Maine] was exceptionally warm,” said Kathy Mills, who runs the Integrated Systems Ecology laboratory at the Gulf of Maine Research Institute. “I was very surprised.”
The Gulf of Maine is warming faster than 96 percent of the world’s oceans, increasing at a rate of 0.1 degrees Celsius (0.18 degrees Fahrenheit) annually over the past four decades.
The increased concentration of greenhouse gases in the atmosphere traps heat in the air. The air in contact with the ocean transfers heat to the ocean, increasing what is called the ocean heat content (OHC).
The first measurements of ocean data were taken on Capt. James Cook’s second voyage (1772-1775). Although not very accurate, those measurements were among the first instances of oceanographic data recorded and preserved.
Today, ocean measurements are taken by a variety of modern instruments deployed from ships, airplanes, satellites and, more recently, underwater robots. A 2013 study by John Abraham, a professor at the University of St. Thomas, contains an interesting historical overview of ocean measurements.
Abraham’s study used data from new instruments, such as expendable bathythermographs and Argo floats. The Argo program is an array of more than 3,000 autonomous floats that return oceanic climate data and has advanced the breadth, quality and distribution of oceanographic data.
As heat accumulates in the Earth’s oceans, they expand in volume, making this expansion one of the largest contributors to sea-level rise.
Although concentrations of greenhouse gases have risen steadily, the change in ocean heat content varies from year to year, as the chart above shows. Year-to-year changes are influenced by events, such as volcanic eruptions and recurring patterns such as El Niño. In fact, in the chart one can detect short-term cooling from major volcanic eruptions of Mounts Agung (1963), El Chichón (1982) and Pinatubo (1991).
The ocean’s temperature plays an important role in the Earth’s climate crisis because heat from ocean surface waters provides energy for storms and influences weather patterns.
Roger Warburton, Ph.D., is a Newport, R.I., resident. He can be reached at [email protected].
References: Cheng, L. J, and Coauthors, 2022, “Another record: Ocean warming continues through 2021 despite La Niña conditions. Adv. Atmos. Sci., https://doi.org/10.1007/s00376-022-1461-3.
Abraham, J. P., et al. (2013), “A review of global ocean temperature observations: Implications for ocean heat content estimates and climate change,” Rev. Geophys.,51, 450–483, https://agupubs.onlinelibrary.wiley.com/doi/full/10.1002/rog.20022.