Oligarch Overload
How Ultra-Rich Donors Have Flooded American Politics With Cash Since Citizens United
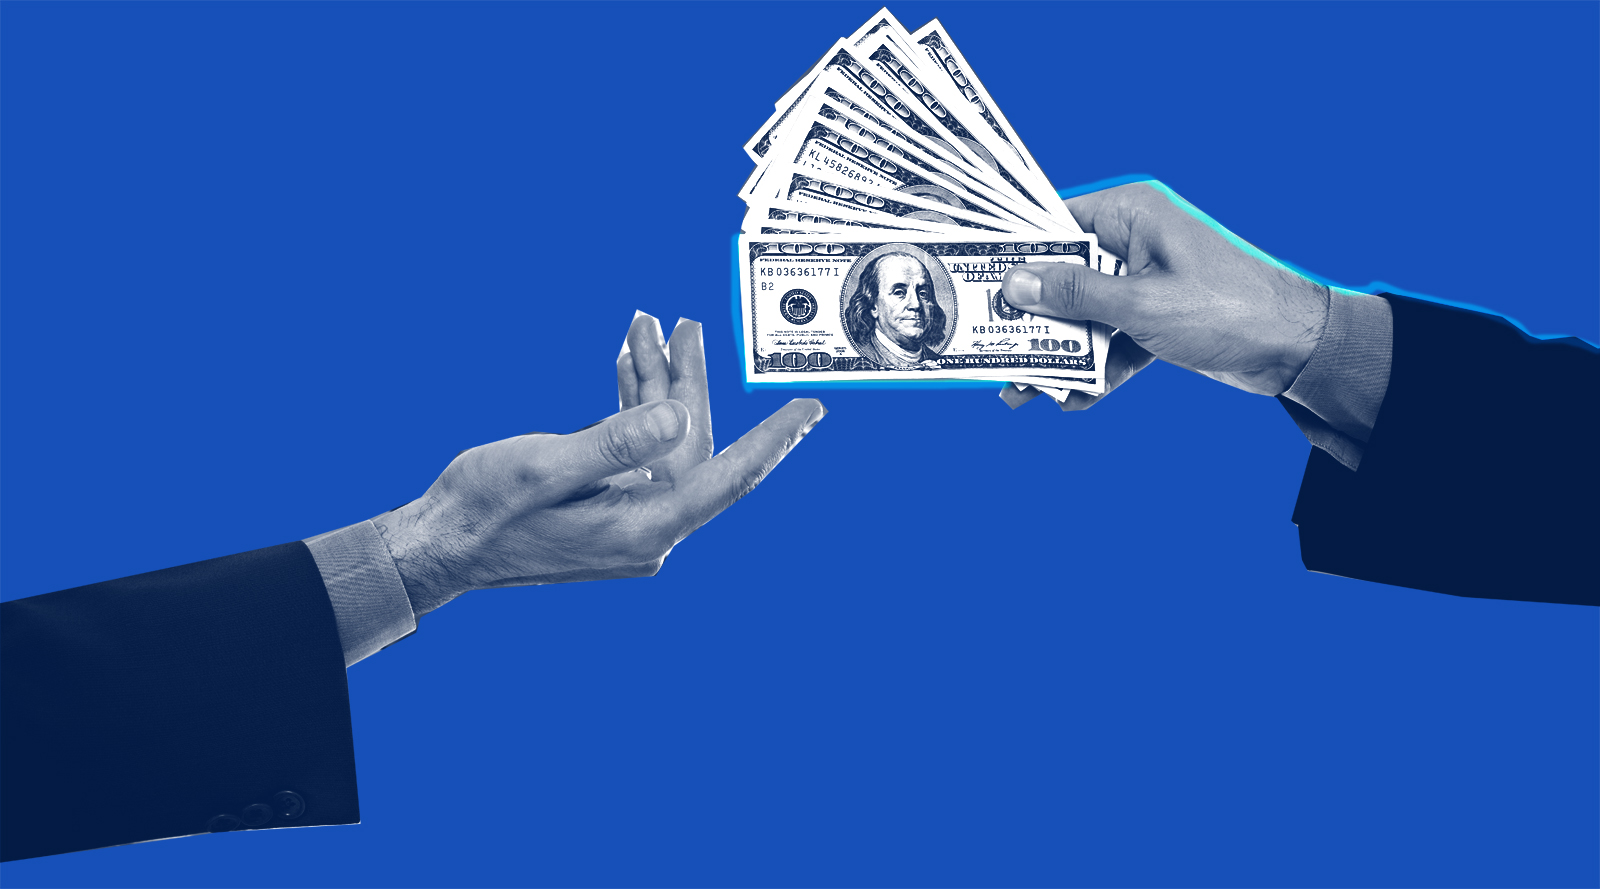
Just 25 ultra-rich individual political donors, including numerous billionaires, have poured nearly $1.4 billion into super PACs in the decade since the U.S. Supreme Court opened the doors to a massive influx of big money in politics.
A Public Citizen analysis found that the political donations of these 25 people and their spouses amounted to nearly half of nearly $3 billion in total individual super PAC donations from 2010-2020, demonstrating the surging influence of mega-donors on American politics over the past decade.
Public Citizen also analyzed super PAC and campaign donations in more than 16,700 zip codes and found that the largest political donors in the top 10 majority white zip codes gave $1.85 billion from 2010 through 2018, while the biggest political donors in the top 10 majority-minority zip codes gave $179 million in the same time period.
Super PACs are political action groups that can take unlimited donations and make unlimited election expenditures so long as they do not directly coordinate with candidates’ campaigns. Their growth of Super PACs comes in the wake of the U.S. Supreme Court’s 2010 Citizens United v. Federal Election Commission decision. That decision allowed unlimited contributions from corporations and wealthy individuals to influence elections. Individual donors are the primary funders of super PACs, which are required to disclose their donors, unlike “dark money” nonprofits, which are not required to do so.
Key Findings
Public Citizen’s analysis of Federal Election Commission data on more than 150,000 individual contributors to super PACs since 2020 found that:
- Just 25 ultra-wealthy donors have made up nearly half (47 percent) of all contributions by individuals to super PACs since 2010, providing about $1.4 billion in super PAC contributions out of nearly $3 billion in super PAC contributions from individuals.
- The five largest individual super PAC contributors donated a combined $838 million to super PACs, or 28 percent of all donations.
In the early years of the post-Citizens United era, the amount of money donated to outside spending groups was heavily tilted in favor of Republicans. But Democrats have become increasingly reliant on super PAC funding from hedge fund managers, bankers and other financial executives supplied. The financial industry represented 74% of funding for pro-Democrat outside spending efforts in the 2017-2018 cycle compared with 25% of funding for pro-Republican efforts, a 2019 Public Citizen analysis found. In the 2017-2018 cycle the top individual donors gave $359 million, or 52 percent, to outside spending groups benefiting Democrats and $312 million, or 45 percent, to benefiting Republicans.
Even before the rise of Super PACs and unlimited donations, low-income, majority-minority districts were highly under-represented among campaign contributions. The biggest donors traditionally have been highly concentrated in New York, Washington D.C., Chicago and other big cities.
For example, the top contributing zip code to presidential campaigns during the 2004 election cycle was 10021, on Manhattan’s Upper East Side. Contributors in that one exclusive zip code sent $4.2 million to presidential candidates that year, according to a report on donations of over $200 by Public Campaign, the Fannie Lou Hamer Project and the William C. Velasquez Institute. That one zip code provided more presidential campaign money than the 377 zip codes with the largest proportion of African Americans and the 365 zip codes with the largest proportion of Latino or Hispanic Americans, according to the report. Public Campaign also analyzed the 2000 and 2002 election cycles found that nearly 90 percent of $2 billion in contributions of more than $200 came from zip codes that were majority non-Hispanic white. By comparison, under 2 percent of all campaign funds came from majority Latino zip codes and 3 percent from majority African American zip codes.
Another released in 2016 by Demos, found that, among donors to presidential campaigns that year, 91 percent were white. White men made up nearly half of donors that year, even though they are only 35 percent of the adult population. Whites made up more than 90 percent of federal election donors in the 2012 and 2014 election cycles, and 94 percent of donors giving more than $5,000 in the 2014 election cycle. White men were 64 percent of Trump’s donors but only 33 percent of Hillary Clinton’s donors. Both candidates relied on the wealthy for funding: Clinton raised 42 percent of her money from millionaires, who represent 3 percent of the adult population, while Trump raised 27 percent from millionaires, the report found.
Taken together, this research highlights the extraordinary influence of the wealthiest, most powerful elements of American society on our campaign finance system. While the country has become more diverse over the past 15 years, the gap in political influence between majority-white areas remains extraordinary. In a new analysis, Public Citizen examined the geographic concentration of both individual and Super PAC donors from 2010-2018 and matched that data to U.S. Census demographic information. Even controlling for the much larger size the white population in America, households in majority-white zip codes donate far more money than black or Hispanic political donors.
Zip Code Analysis
The analysis of political donations from 16,752 zip codes found that from 2010 through 2018:
- Political donors in the top 10 majority white zip codes for campaign donations gave $874 million to candidates, while the top 10 majority-white zip codes for super PAC donations gave $977 million, for a total of $1.85 billion.
- Political donors in 10 majority-minority zip codes for campaign donations gave $111 million to candidates, while the top 10 majority minority zip codes for super PAC donations gave $68 million, for a total of $179 million.
- Political donors in all 15,411 majority-white zip codes analyzed gave about $7 billion, or $84 per household, to political campaigns and nearly $2.8 billion, or $33 per household, to super PACs.
- Political donors in all 1,341 majority-minority zip codes analyzed gave $352 million, or $28 per household, to political campaigns and more than $100 million, or $8 per household, to super PACs.
Top Super PAC Contribution Zip Codes, Majority NonHispanic White
| ZIP | City | State | SuperPAC2010-2018 | Households | Median household income | Non Hispanic White |
|---|---|---|---|---|---|---|
| 89109 | Las Vegas | NV | $197,587,825 | 3972 | $46,875 | 52.5% |
| 10022 | New York | NY | $169,620,382 | 17873 | $133,208 | 83.4% |
| 20036 | Washington | DC | $111,941,268 | 4171 | $80,977 | 72.8% |
| 89145 | Las Vegas | NV | $100,494,072 | 9614 | $56,424 | 63.3% |
| 20005 | Washington | DC | $94,261,730 | 8172 | $94,506 | 56.2% |
| 10019 | New York | NY | $76,129,783 | 24512 | $99,063 | 64.5% |
| 60614 | Chicago | IL | $69,166,610 | 33591 | $100,116 | 81.6% |
| 60045 | Lake Forest | IL | $63,766,938 | 7317 | $176,108 | 91.7% |
| 10010 | New York | NY | $47,066,514 | 15972 | $115,084 | 68.9% |
| 60611 | Chicago | IL | $46,645,483 | 20487 | $96,040 | 75.8% |
| 90067 | Los Angeles | CA | $37,893,657 | 1342 | $123,889 | 75.8% |
| 10075 | New York | NY | $35,791,129 | 11373 | $129,594 | 83.3% |
| 60603 | Chicago | IL | $32,543,403 | 563 | $140,114 | 58.6% |
| 33301 | Fort Lauderdale | FL | $28,862,211 | 7571 | $85,219 | 78.9% |
| 20003 | Washington | DC | $26,136,608 | 12394 | $118,607 | 68.4% |
| 60606 | Chicago | IL | $26,088,582 | 1979 | $139,179 | 69.8% |
| 33401 | West Palm Beach | FL | $25,567,700 | 11221 | $46,571 | 52.8% |
| 72201 | Little Rock | AR | $24,354,750 | 602 | $69,118 | 74.6% |
| 75219 | Dallas | TX | $22,859,204 | 13990 | $67,311 | 67.0% |
| 82922 | Bondurant | WY | $22,855,000 | 107 | $83,510 | 100.0% |
| 68131 | Omaha | NE | $21,963,200 | 5495 | $35,630 | 58.8% |
| 11733 | East Setauket | NY | $21,451,162 | 5613 | $147,330 | 85.9% |
| 10573 | Port Chester | NY | $21,089,472 | 12360 | $76,097 | 51.4% |
| 30327 | Atlanta | GA | $19,583,097 | 9333 | $148,480 | 85.3% |
| 75225 | Dallas | TX | $18,602,724 | 8846 | $173,828 | 92.6% |
Top Campaign Contribution Zip Codes, Majority NonHispanic White
| ZIP | City | State | Individual 2010-2018 | Households | Median household income | Non Hispanic White |
|---|---|---|---|---|---|---|
| 20005 | Washington | DC | $232,095,563 | 8172 | $94,506 | 56.2% |
| 20004 | Washington | DC | $163,742,226 | 1163 | $144,583 | 73.1% |
| 20036 | Washington | DC | $138,287,162 | 4171 | $80,977 | 72.8% |
| 22314 | Alexandria | VA | $111,721,751 | 17096 | $122,689 | 76.8% |
| 20003 | Washington | DC | $65,782,614 | 12394 | $118,607 | 68.4% |
| 60611 | Chicago | IL | $36,245,855 | 20487 | $96,040 | 75.8% |
| 22102 | McLean | VA | $34,087,905 | 10400 | $114,310 | 63.4% |
| 22209 | Arlington | VA | $32,156,215 | 7183 | $106,424 | 65.2% |
| 10021 | New York | NY | $30,571,736 | 24912 | $123,842 | 81.5% |
| 10024 | New York | NY | $30,285,758 | 28418 | $126,107 | 80.0% |
| 10022 | New York | NY | $29,777,216 | 17873 | $133,208 | 83.4% |
| 10023 | New York | NY | $29,235,762 | 33133 | $123,951 | 76.2% |
| 22202 | Arlington | VA | $29,180,947 | 12940 | $107,760 | 66.3% |
| 20007 | Washington | DC | $28,163,907 | 11885 | $123,154 | 77.6% |
| 22042 | Falls Church | VA | $27,349,046 | 12190 | $103,119 | 55.5% |
| 22101 | McLean | VA | $25,627,953 | 10457 | $190,009 | 79.7% |
| 20815 | Chevy Chase | MD | $24,162,785 | 12953 | $150,313 | 80.7% |
| 19103 | Philadelphia | PA | $23,982,924 | 14496 | $70,638 | 75.5% |
| 20016 | Washington | DC | $23,628,056 | 13757 | $140,545 | 80.0% |
| 10128 | New York | NY | $22,860,145 | 31644 | $111,937 | 74.0% |
| 22203 | Arlington | VA | $22,694,110 | 11736 | $104,171 | 67.8% |
| 20008 | Washington | DC | $22,071,823 | 15611 | $120,342 | 75.3% |
| 20814 | Bethesda | MD | $20,750,965 | 12925 | $120,632 | 75.1% |
| 10028 | New York | NY | $19,444,641 | 26435 | $119,203 | 84.7% |
| 10065 | New York | NY | $19,323,942 | 15878 | $124,322 | 85.0% |
$200 ) Federal Election Commission (Super PAC contributions)