Upskilling for an Equitable Recovery: Hardest-Hit New Yorkers Most Vulnerable to Automation
Many of the New Yorkers who have been hit hardest by job losses in recent months are also the workers most vulnerable to automation. New York City's next mayor should create an automation preparation plan to ensure an inclusive economic recovery.
by Eli Dvorkin, Charles Shaviro, and Laird Gallagher
Many of the New Yorkers who have been hit hardest by job losses in recent months are also the workers most vulnerable to automation, a fast-moving trend that’s only accelerated during the pandemic and which could displace even more workers in the months ahead. This finding, the result of the first-ever analysis of the populations in New York City most likely to be affected by the growing wave of automation, suggests that city officials—including those running for office in 2021—will need to make substantial investments in upskilling and lifelong learning in order to ensure an inclusive recovery.
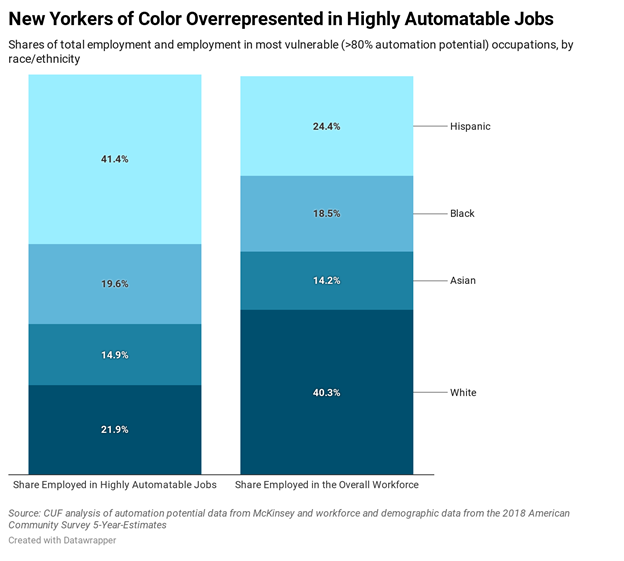
Our analysis reveals that the jobs most vulnerable to automation are disproportionately held by New Yorkers who are Hispanic, younger, and male, with the jobs of young men of color most at-risk. Among occupations that are the most highly automatable using technology that exists today, 76 percent of jobs are held by Black, Hispanic, and Asian New Yorkers, even though they make up just 57 percent of the city’s total workforce. (This analysis defines “highly automatable” occupations as jobs in which 80 percent or more of their constituent job tasks can be performed by software or machines, using technology that exists today.)
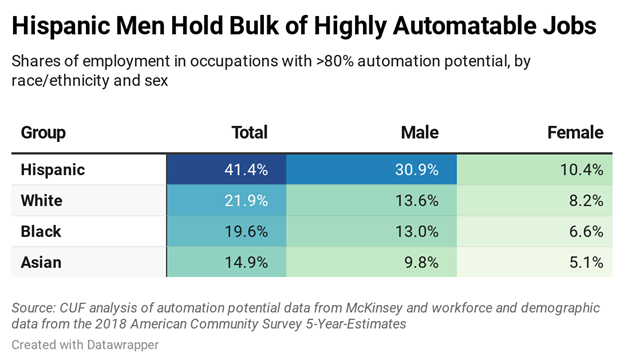
Hispanic New Yorkers are particularly overrepresented in occupations highly vulnerable to automation. Fully 41 percent of highly automatable jobs are held by Hispanic New Yorkers (who make up 24 percent of the workforce), 20 percent by Black workers (19 percent of the workforce), and 15 percent by Asian workers (14 percent of the workforce), while 22 percent are held by white workers (who comprise 40 percent of the workforce).
The disparity is even sharper among the ten largest occupations in New York City that are highly automatable—including drivers, food prep workers, and stockers and order fillers—where the workforce is 43 percent Hispanic and just 20 percent white. Of the 11 occupations with the highest share of Hispanic employment in New York City, 7 have above average automation potential. For instance, 75 percent of all dishwashers in the city are Hispanic, according to CUF’s analysis of data from the U.S. Census Bureau, and this occupation is among the most highly automatable in the city (86 percent of job tasks can be automated using existing technology). Likewise, 56 percent of all New Yorkers employed as cooks are Hispanic—and this occupation is 88 percent automatable.
Overall, the analysis finds that men of all backgrounds are more than twice as likely to be employed in highly automatable jobs as are women. Almost 69 percent of highly automatable jobs in New York City are held by men, compared to 31 percent held by women. This is due in large part to the overrepresentation of women in the caring professions, which generally have low automation potential. Preschool and kindergarten teachers (94 percent female), home health aides (93 percent women), child care workers (93 percent), personal care aides (85 percent), teacher’s assistants (79 percent), and social workers (79 percent) collectively employ over 200,000 women in New York City and have an automation potential of less than 20 percent.
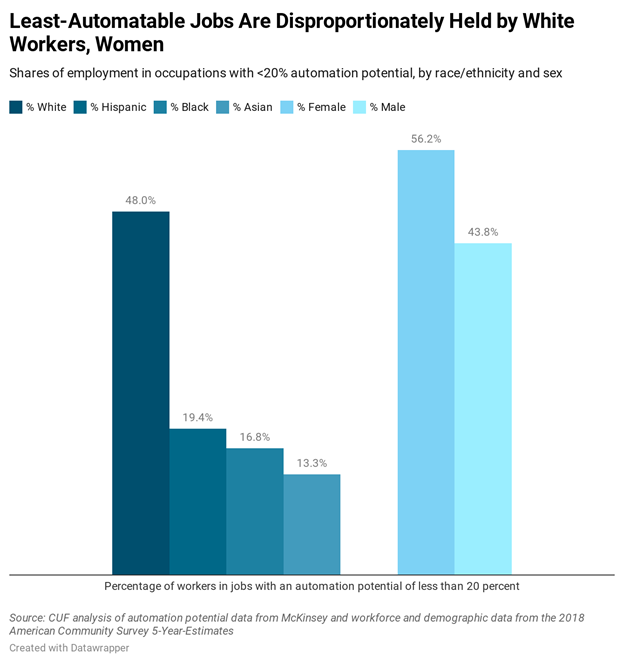
In general, white New Yorkers are better shielded from automation. In many of the largest occupations in New York City with low potential for automation, the workforce is disproportionately white. In the 121 occupations with an automation potential of less than 20 percent, the workforce is 48 percent white, 19 percent Hispanic, 17 percent Black, 13 percent Asian, 56 percent female, and 44 percent male.
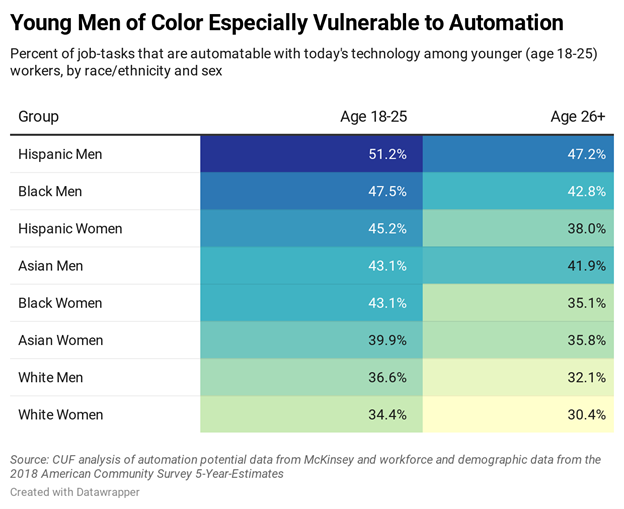
Across the board, men of color face a disproportionately high level of exposure to automatable work. Nearly half of all job tasks performed by Hispanic male workers in New York City are automatable (48 percent). The share is nearly as high for Black men (43 percent) and Asian men (42 percent). In contrast, the share of job tasks considered automatable in jobs held by white men is much lower (33 percent). For Hispanic men between the ages of 18 and 25, the risk is even higher: fully 51 percent of all job tasks performed by New Yorkers in this group can be automated using current technology.
Finally, this analysis shows that the youngest New Yorkers in the workforce are more vulnerable to automation than workers 25 and older. More than 11 percent of the jobs held by New Yorkers ages 18 to 24 are highly automatable, compared to 8 percent of jobs held by New Yorkers over 25. But while the city’s youngest workers are more vulnerable across nearly every demographic group, there is one notable exception: More than 13 percent of all employed Asian New Yorkers over the age of 55 hold highly automatable jobs—making older adults the most vulnerable group among all Asian workers.
Just because a job is vulnerable to automation does not mean it will vanish. However, the skills needed to land and keep that job are likely to increase, pushing previously accessible jobs further out of reach. Jobs in fields from construction and manufacturing to transportation and food service will require higher levels of digital literacy and computer skills. Warehouse employees will work alongside robots—and new jobs will be created to manage and troubleshoot these machines. But these new opportunities will require new skills and competencies—or else many of the city’s most vulnerable workers could be left out of an economic rebound.
To help more New Yorkers regain employment as the city’s economy begins to recover while getting ahead of the shift toward a more automated economy, city leaders—including the next mayor—will have to take decisive steps to strengthen and expand the city’s upskilling infrastructure. This should include launching an Automation Preparation Plan to develop new upskilling pathways and programs; scaling up technology training and digital literacy programs offered by nonprofit providers and the city’s public library systems; guiding a major expansion of online and hybrid short-term credentials aligned with industry needs and provided through the City University of New York and other postsecondary institutions; and creating city-sponsored lifetime training accounts that can make upskilling easier by encouraging workers to save for future training while providing displaced workers with credits for a wide variety of eligible courses and certificates.
As technological innovation and the effects of the pandemic spur more rapid adoption of automation—in occupations from customer service and cashiers to drivers and dishwashers—thousands of New York City jobs are poised to transform significantly in the years ahead, and some may disappear completely. This analysis suggests that the impact of these changes won’t be felt equally.
Women hold a much smaller share of highly automatable jobs than men do: Just 31 percent of all highly automatable jobs, compared to 69 percent held by men. However, the jobs held by women of color have a higher automation potential than the jobs held by white women. Less than 31 percent of the job tasks performed by white women are automatable, compared with 39 percent for Hispanic women and 36 percent for both Black and Asian women. For younger women of color, those risks are even more pronounced.
The risk disparities identified in this report are magnified among younger New Yorkers of color. While fewer than 2 in 5 of the job tasks of young white men ages 18 to 25 are automatable, over half (51 percent) of the job tasks performed by young Hispanic men are automatable, as are 48 percent of the job tasks performed by young Black men, 45 percent of the job tasks performed by young Hispanic women, and 43 percent of those done by young Asian men and Black women.
Younger workers’ increased vulnerability to automation is reflected in the jobs that they are more likely to hold. Four of the five occupations most common among the city’s workers ages 18 to 25 have above average automation potential: Cashier (30,728 younger workers, automation potential of 49 percent), Retail Salesperson (29,529 younger workers, 47 percent), Waiter/Waitress (16,687 younger workers, 77 percent), and Secretary/Administrative Assistant (10,403 younger workers, 54 percent).
At the same time, the least-automatable jobs are disproportionately held by white New Yorkers. Across the 121 occupations with an automation potential of less than 20 percent, the workforce is 48 percent white, 19 percent Hispanic, 17 percent Black, and 13 percent Asian, despite white New Yorkers making up just 40 percent of the city’s total workforce.
Other key findings of the report include:
Many of the largest occupations with the highest automation potential have a disproportionately Hispanic/Black and male workforce.
Of the ten largest occupations that are highly automatable (>80%), the workforce is 43.4 percent Hispanic, 20 percent Black, 14 percent Asian, and just 20 percent white. This highly automatable workforce is 73 percent male and 27 percent female.
These disparities are driven by the overrepresentation of Black, Hispanic, and male workers in most of the city’s most vulnerable occupations.
For instance, more than 50,000 cooks are employed in New York City, an occupation that is 88 percent automatable. The cook workforce is 56 percent Hispanic, 17 percent Black, 14 percent Asian, and just 11 percent white. About 72 percent of cooks are male and 28 percent female.
Stockers and order fillers (86 percent automatable, employing 30,000 New Yorkers) are 41 percent Hispanic, 28 percent Black, 14 percent white, and 14 percent Asian. They are 78 percent male and 22 percent female.
Food prep workers (91 percent automatable, employing 29,000 New Yorkers) are 51 percent Hispanic, 19 percent Asian, 15 percent Black, and 13 percent white. They are 64 percent male and 34 percent female.
Dishwashers (7,000 New Yorkers, 86 percent automatable) are 75 percent Hispanic, 15 percent Black, 7 percent Asian, and 4 percent white. They are 92 percent male and 8 percent female.
Women in New York are generally less at risk of automation due to overrepresentation in the caring professions, but there are notable exceptions.
Majority-women caring professions generally have low automation potential. Of the over 100,000 New Yorkers employed as home health aides and childcare workers—occupations in which fewer than 20 percent of tasks can be automated—over 93 percent are women.
Preschool and kindergarten teachers (94 percent female), personal care aides (85 percent), teacher’s assistants (79 percent), and social workers (79 percent) collectively employ over 100,000 women and have an automation potential of less than 20 percent.
One notable exception is nursing assistants—91 percent female, employing over 85,000 women—which has above-average automation potential, with 44.2 percent of job tasks automatable.
Majority-women clerical professions are at far greater risk of automation. Together, the workforce of word processors and typists; payroll and timekeeping clerks; billing and posting clerks; and bookkeeping, accounting, and auditing clerks is 77 percent female—more than 40,000 in all. These occupations are all over 80 percent automatable.
In many of the largest occupations that have low automation potential, the workforce is disproportionately white
Of the 121 occupations with less than 20 percent automation potential, the city workforce is 48 percent white, 19 percent Hispanic, 17 percent Black, 13 percent Asian, 56 percent female, and 44 percent male.
The low-automation occupation employing the greatest number of New Yorkers—elementary and middle school teachers (18.2 percent automatable, 108,000 New Yorkers)—is 57 percent white, 18 percent Black, 15 percent Hispanic, 7 percent Asian, 76 percent female, and 24 percent male.
The second-largest such occupation, accountants and auditors (12.2 percent automatable, 84,000 New Yorkers) is 50 percent white, 25 percent Asian, 12 percent Black, 11 percent Hispanic, 52 percent male, and 48 percent female.
First-line supervisors of non-retail sales workers (20 percent automatable, 40,000 New Yorkers) are 58 percent white, 16 percent Asian, 15 percent Hispanic, 10 percent Black, 67 percent male, and 33 percent female.
Management analysts (4.1 percent automatable, 39,000 New Yorkers) are 63 percent white, 19 percent Asian, 9 percent Hispanic, 7 percent Black, 59 percent male, and 41 percent female.
Education and childcare administrators (16.2 percent automatable, 35,000 New Yorkers) are 55 percent white, 18 percent Black, 16 percent Hispanic, 7 percent Asian, 66 percent female, and 34 percent male.
Software developers (17 percent automatable, 37,000 New Yorkers) are 47 percent white, 40 percent Asian, 7 percent Hispanic, 3 percent white, 85 percent male, and 15 percent female.
Hispanic New Yorkers are especially vulnerable to automation-linked job displacement
Seven of the 11 occupations with the highest Hispanic employment have above average automation potential. Cooks (88 percent automation potential) and driver/sales workers and truck drivers (81 percent) are highly automatable, and waiters and waitresses (77 percent), secretaries and administrative assistants (54 percent), cashiers (49 percent), retail salespersons (47 percent), and nursing assistants (44 percent) have above average automation potential, while construction laborers (35 percent), janitors and building cleaners (22 percent), childcare workers (19 percent), and maids and housekeeping cleaners (18 percent) all have lower automation potential.
Across every age group, Hispanic New Yorkers are most likely to be working highly automatable jobs. Among New Yorkers age 18 to 24, 16 percent of Hispanic workers are in a highly automatable occupation. The same is true for 14 percent of Hispanic workers ages 25 to 34,15 percent for ages 35 to 44, 15 percent for ages 45 to 54, and 14 percent for ages 55-plus.
51 percent of the job tasks of Hispanic male workers age 18-25 are considered automatable, higher than for any other group.
45 percent of the job tasks of Hispanic women age 18-25 are considered automatable, higher than for any other group.
Over 42 percent of the New Yorkers employed in occupations with an automation potential of 90 percent or higher are Hispanic.
Black New Yorkers disproportionately work in occupations with above-average automation potential
Five of the nine occupations with the highest Black employment have above average automation potential. Secretaries and administrative assistants (54 percent), cashiers (49 percent), retail salespersons (47 percent), nursing assistants (44 percent), security guards and gaming surveillance officers (39 percent) all have above-average automation potential, while registered nurses (29 percent), janitors and building cleaners (22 percent), elementary and middle school teachers (18 percent), and home health aides (11 percent) have lower automation potential.
45.6 percent of the job tasks of Black workers age 18-24, 39.3 percent of the job tasks of those age 25-34, 38.5 percent of the tasks of those age 35-44, and 39.1 percent of the tasks of those age 45-54 are considered automatable with today’s technology.
47.5 percent of the job tasks of age 18-25 Black men are considered automatable, as are 43.1 percent of the job tasks of age 18-25 Black women.
Younger New Yorkers of all backgrounds are more likely to hold jobs at-risk of automation.
The job tasks of New York’s age 18-25 workforce are 43.6 percent automatable, compared to 35.9 percent for age 26-34, 36.7 percent for age 35-44, 38.0 percent for age 45-54 New Yorkers, and 36.7 percent for age 55 and above.
11.4 percent of age 18-25 New Yorkers’ jobs are highly automatable, compared to just 7.4 percent for age 26-34, 8.3 percent for age 35-44, 9.3 percent for age 45-54, and 8.8 percent for age 55 and above.
Although only 11 percent of New York’s total workforce is aged 18-25, younger workers make up 13.5 percent of workers in the city’s highly automatable occupations. Hispanic workers ages 18-25 are just 3.4 percent of the total workforce, but 6.2 percent of workers in highly automatable occupations. Black workers ages 18-25 are 2.1 percent of the total workforce, but 3.1 percent of workers in highly automatable occupations. Meanwhile, white workers ages 18-25 make up 3.8 percent of the total workforce but only 2.6 percent of the workers in highly automatable occupations. Asian workers make up 1.3 percent of the total workforce and 1.2 percent of employment in highly automatable occupations.
What NYC Should Do to Upskill for an Equitable Recovery
To cultivate an equitable recovery and rebuild a more inclusive economy, New York City will need to create and strengthen upskilling infrastructure across all five boroughs. Doing so will not only help the hundreds of thousands of New Yorkers currently experiencing unemployment to reconnect with the workforce; it will lay the groundwork for lifelong education accessible to all New Yorkers and help prepare the city’s workers for the challenges and opportunities of a more automated economy.
This economic transformation is already underway and likely to receive a major push from the long-term effects of the pandemic. Rising demand for e-commerce, lowered transition costs due to business disruption, and public health concerns have pushed online retailers and grocery chains to invest in automating their fulfillment and warehousing operations, while hotels and restaurants have shifted to contactless services. In the years ahead, major occupations from delivery drivers to accountants and bookkeepers are likely to follow suit as software and machines become increasingly adept at performing human work.
New York City cannot afford to take a wait-and-see approach—policymakers should prepare for the future of work by building out the city’s skills-building and retraining infrastructure. But the threat of automation is far from the only reason for significant investment in reskilling and job training. Over a year since the pandemic hit, the city still faces a staggering 13 percent unemployment rate. For the hundreds of thousands of New Yorkers who have lost their jobs due to the economic fallout, access to new opportunities in higher-wage, growing industries like technology, healthcare, and the creative economy—industries likely to add jobs even as automation increases—will be crucial to their and the city’s economic success.
There are concrete steps that the city can take to scale up New York’s education and retraining infrastructure. Here are five ways that city leaders can prepare for a more automated economy and help hundreds of thousands of New Yorkers get back into the workforce:
The next mayor should launch an Automation Preparation Plan for New York City. As more and more occupations automate—from stock clerks to bookkeepers—a large number of existing jobs are poised for transformation, and new jobs are likely to require a higher level of technical skills. But while New York City has an array of good workforce training programs focused on preparing residents for jobs, there are far too few resources and options aimed at helping current workers navigate a job transition and bolster their skills across the arc of a career. The next mayor should come equipped with a bold plan to prepare New Yorkers to thrive in an increasingly automated economy. This plan should include new investments in upskilling and lifelong learning initiatives that can help New Yorkers adapt to jobs reshaped by technological disruption and prepare for new opportunities in high-growth sectors like tech, health care, and the creative industries.
Scale up the city’s most effective job training programs. New York City is home to a number of high-quality, in-depth job training programs that have proven effective at helping New Yorkers with limited formal education and no direct work experience to move into well-paying sectors like tech, healthcare, construction, and the creative industries. But these programs are serving no more than a few dozen to a few hundred people each year. City leaders should work with the state, philanthropy, and impact investors to scale up the most effective programs with infrastructure investments, low- or no-interest financing to add capacity, and support for outreach and recruitment, and set a goal of launching 10,000 new paid apprenticeship programs in a range of growing industries.
Invest in bridge programs to build onramps to education and training. Many of the New Yorkers hit hardest by the COVID pandemic—and most vulnerable to dislocation in a more automated economy—lack some of the basic skills needed to access the city’s high-quality job training programs. More than one million adults in New York City do not have a high school diploma, and thousands more lack the specific literacy or math skills needed to pursue training. To ensure that these New Yorkers can access effective training and higher education, city leaders should support a major expansion of bridge programming in partnership with CUNY, adult education providers, and workforce development organizations. These programs are designed to provide the necessary skills boost needed to plug into high-quality training or further education, but just a handful are in operation today.
Establish digital literacy hubs in every neighborhood. No matter the sector or industry, landing a well-paying job will require an increasing level of digital literacy in the years to come. To ensure that far more New Yorkers can build their digital skills, city leaders should establish digital literacy hubs in every community. The best place to start would be with the city’s branch libraries, which are embedded in nearly every neighborhood citywide and already offer a wide range of digital skills-building programs—but currently experience long waiting lists and have limited seats. New investment in the capacity of branch libraries to provide digital skills training could bring these vital programs to within a mile or two of most New York City residents.
Create NYC Lifetime Training Accounts and seed them with credits for displaced workers. For workers experiencing unemployment and those whose jobs are likely to be disrupted in the near future, the ability to access high-quality training can help shorten the time spent unemployed and build links into better-paying careers. But affording that training after losing a job can be nearly impossible. Establishing city-sponsored lifetime training accounts would make those transitions easier by encouraging workers to save for future training. Modeled on several successful pilot programs that have operated across the country since 2001, these portable accounts could be employer-matched, like retirement plans; allow workers to save pre-tax dollars; and travel with workers—including workers in the gig economy—from job to job. For low-income workers who lose a job due to automation, these accounts could also be seeded with public dollars in the form of a flexible skills-building grant.
Methodology:
This report analyzes demographic data from the 2018 American Community Survey 5-year-estimates on New York City’s workforce, which is merged with automation potential estimates developed on the occupation level by McKinsey & Company. A matching occupation in the McKinsey dataset was found for 99.7 percent of the Census microdata on New York City’s workforce; the resulting analysis provides detailed insights into the automatability and demographic composition of nearly every occupation in New York City.
Appendix Tables:
Automation Potential of NYC's 25 Largest Occupations
Occupation
Automation Potential
Total Employment
Share White
Share Black
Share Hispanic
Share Asian
Share Male
Share Female
Managers, All Other
28.3%
126,846
58.1%
10.5%
13.0%
15.4%
60.3%
39.7%
Elementary and Middle School Teachers
18.2%
108,085
56.7%
18.2%
15.4%
7.1%
24.3%
75.7%
Janitors and Building Cleaners
22.4%
103,266
16.0%
24.4%
52.4%
5.6%
72.1%
27.9%
Retail Salespersons
46.8%
95,310
31.6%
23.0%
27.8%
14.9%
49.4%
50.6%
Nursing Assistants
44.2%
93,602
11.3%
46.0%
28.9%
10.6%
8.5%
91.5%
Secretaries and Administrative Assistants, Except Legal, Medical, and Executive
53.6%
92,390
43.9%
19.1%
26.8%
7.9%
8.6%
91.4%
Accountants and Auditors
12.2%
84,614
49.7%
11.6%
11.1%
24.9%
52.5%
47.5%
Lawyers, and judges, magistrates, and other judicial workers
24.9%
84,540
76.2%
6.7%
7.5%
7.8%
60.6%
39.4%
Cashiers
48.6%
83,478
14.9%
22.0%
37.7%
22.0%
33.0%
67.0%
Registered Nurses
28.9%
81,103
30.7%
31.2%
9.8%
25.4%
14.0%
86.0%
Construction Laborers
34.9%
75,570
22.4%
12.9%
51.8%
10.5%
97.3%
2.7%
FirstLine Supervisors of Retail Sales Workers
32.7%
65,817
40.8%
15.0%
24.0%
16.8%
60.2%
39.8%
Financial Managers
33.9%
65,698
58.9%
9.1%
12.1%
18.0%
61.7%
38.3%
Customer Service Representatives
29.3%
63,452
30.9%
24.3%
29.4%
12.3%
39.9%
60.1%
Driver/Sales Workers and Truck Drivers
81.4%
63,152
21.3%
23.2%
40.5%
12.9%
96.5%
3.5%
Maids and Housekeeping Cleaners
17.9%
61,661
10.4%
19.2%
56.7%
11.4%
16.0%
84.0%
Childcare Workers
19.4%
57,390
15.7%
29.5%
42.9%
9.0%
7.2%
92.8%
Waiters and Waitresses
76.9%
56,248
30.2%
10.9%
39.5%
17.3%
52.1%
47.9%
Security Guards and Gaming Surveillance Officers
39.4%
53,676
15.5%
49.0%
27.3%
6.1%
78.7%
21.3%
Teacher Assistants
19.9%
52,739
37.9%
21.3%
29.9%
8.6%
20.9%
79.1%
Chief Executives and Legislators
25.0%
52,691
72.6%
5.6%
7.6%
11.9%
70.9%
29.1%
Home Health Aides
10.8%
52,663
12.1%
39.9%
33.1%
12.4%
6.3%
93.7%
Cooks
88.2%
52,440
10.9%
17.3%
55.7%
14.4%
72.1%
27.9%
Taxi Drivers
76.0%
49,688
11.8%
20.7%
28.0%
36.6%
96.1%
3.9%
Office Clerks, General
61.5%
48,925
29.5%
28.2%
23.1%
16.5%
29.6%
70.4%
Top 25 Largest Occupations with Automation Potential >80%
Occupation
Automation Potential
Total Employment
Share White
Share Black
Share Hispanic
Share Asian
Share Male
Share Female
Driver/Sales Workers and Truck Drivers
81.4%
63,152
21.3%
23.2%
40.5%
12.9%
96.5%
3.5%
Cooks
88.2%
52,440
10.9%
17.3%
55.7%
14.4%
72.1%
27.9%
Stockers And Order Fillers
86.4%
29,690
14.2%
28.4%
41.1%
14.0%
78.5%
21.5%
Food Preparation Workers
91.4%
29,089
12.9%
14.6%
50.9%
18.8%
63.7%
36.3%
Bookkeeping, Accounting, and Auditing Clerks
85.6%
28,658
43.1%
15.7%
20.7%
17.7%
26.0%
74.0%
Painters and Paperhangers
87.2%
16,848
23.4%
5.3%
61.2%
6.6%
96.8%
3.2%
Bus Drivers, Transit and Intercity
85.4%
14,515
15.0%
46.7%
27.6%
9.6%
85.8%
14.2%
Dining Room and Cafeteria Attendants and Bartender Helpers
86.2%
12,769
9.3%
10.3%
64.9%
14.6%
82.2%
17.8%
Billing and Posting Clerks
87.6%
12,245
42.3%
20.9%
20.1%
13.7%
21.3%
78.7%
Miscellaneous Production Workers, Including Equipment Operators and Tenders
97.2%
12,044
25.7%
16.2%
40.9%
15.0%
67.5%
32.5%
Fast Food And Counter Workers
87.4%
11,445
23.0%
12.8%
37.8%
22.6%
63.4%
36.6%
Word Processors and Typists
90.4%
10,017
33.3%
26.5%
20.6%
16.5%
19.7%
80.3%
Data Entry Keyers
86.4%
8,185
27.4%
28.3%
26.3%
15.1%
33.0%
67.0%
Sewing Machine Operators
97.9%
7,900
9.2%
2.5%
34.0%
53.1%
13.9%
86.1%
Dishwashers
85.6%
7,224
3.6%
14.8%
74.9%
6.5%
91.8%
8.2%
Bakers
93.5%
6,929
17.8%
11.7%
51.2%
17.9%
69.6%
30.4%
Laundry and DryCleaning Workers
89.1%
5,186
7.3%
14.1%
48.5%
29.7%
35.0%
65.0%
Insurance Claims and Policy Processing Clerks
80.6%
5,016
32.6%
26.6%
25.3%
12.0%
35.8%
64.2%
Welding, Soldering, and Brazing Workers
91.9%
4,909
26.2%
21.3%
33.4%
12.6%
97.4%
2.6%
Tailors, Dressmakers, and Sewers
96.5%
4,868
27.3%
13.9%
30.4%
27.5%
39.8%
60.2%
Butchers and Other Meat, Poultry, and Fish Processing Workers
94.4%
3,967
14.7%
11.4%
65.2%
8.6%
90.1%
9.9%
Stationary Engineers and Boiler Operators
83.1%
3,681
48.8%
11.9%
29.6%
6.8%
97.9%
2.1%
Jewelers and Precious Stone and Metal Workers
88.1%
3,499
42.6%
2.2%
32.7%
20.0%
63.4%
36.6%
Payroll and Timekeeping Clerks
87.4%
3,338
32.7%
36.2%
21.2%
9.3%
21.1%
78.9%
Printing Press Operators
86.1%
2,877
28.1%
12.9%
46.2%
11.2%
79.2%
20.8%
Top 25 Largest Occupations with Automation Potential <20%
Occupation
Automation Potential
Total Employment
Share White
Share Black
Share Hispanic
Share Asian
Share Male
Share Female
Elementary and Middle School Teachers
18.2%
108,085
56.7%
18.2%
15.4%
7.1%
24.3%
75.7%
Accountants and Auditors
12.2%
84,614
49.7%
11.6%
11.1%
24.9%
52.5%
47.5%
Maids and Housekeeping Cleaners
17.9%
61,661
10.4%
19.2%
56.7%
11.4%
16.0%
84.0%
Childcare Workers
19.4%
57,390
15.7%
29.5%
42.9%
9.0%
7.2%
92.8%
Teacher Assistants
19.9%
52,739
37.9%
21.3%
29.9%
8.6%
20.9%
79.1%
Home Health Aides
10.8%
52,663
12.1%
39.9%
33.1%
12.4%
6.3%
93.7%
Postsecondary Teachers
15.9%
47,422
64.1%
8.8%
10.5%
14.2%
51.8%
48.2%
Personal Care Aides
10.8%
41,026
11.2%
35.8%
29.5%
20.6%
15.2%
84.8%
FirstLine Supervisors of NonRetail Sales Workers
19.6%
39,980
57.6%
9.6%
14.9%
15.6%
67.0%
33.0%
Management Analysts
4.1%
39,287
62.6%
7.1%
9.4%
18.6%
58.8%
41.2%
Software Developers
17.0%
37,383
47.0%
3.5%
6.9%
40.3%
85.0%
15.0%
Police Officers
19.2%
35,874
40.6%
22.2%
26.9%
8.0%
79.0%
21.0%
Education and Childcare Administrators
16.2%
35,525
55.3%
18.3%
15.9%
7.4%
34.5%
65.5%
Laborers and Freight, Stock, and Material Movers, Hand
6.7%
30,080
26.5%
23.0%
39.4%
8.9%
87.1%
12.9%
Human Resources Workers
16.6%
28,006
52.1%
18.6%
15.7%
10.5%
28.9%
71.1%
Property, Real Estate, and Community Association Managers
15.7%
27,874
51.1%
13.4%
25.2%
7.4%
74.7%
25.3%
Social Workers, All Other
19.9%
27,313
28.9%
41.2%
23.2%
5.2%
20.6%
79.4%
Editors
9.5%
25,483
77.6%
5.8%
5.0%
8.3%
45.8%
54.2%
Financial Analysts
10.6%
24,969
59.0%
6.5%
6.8%
25.9%
74.0%
26.0%
Marketing Managers
13.3%
24,558
66.9%
6.8%
12.2%
11.3%
36.5%
63.5%
Other Designers
13.9%
24,406
56.9%
7.4%
14.2%
18.8%
50.7%
49.3%
Project Management Specialists
2.1%
24,397
62.8%
8.6%
10.1%
16.0%
54.0%
46.0%
Producers and Directors
13.2%
22,474
72.6%
9.4%
10.7%
5.5%
51.9%
48.1%
Personal Financial Advisors
12.3%
22,328
64.0%
7.9%
9.0%
17.3%
73.1%
26.9%
The 25 Occupations with the Highest Automation Potential
Occupation
Automation Potential
Total Employment
Share White
Share Black
Share Hispanic
Share Asian
Share Male
Share Female
Packaging and Filling Machine Operators and Tenders
100.0%
1,825
3.5%
10.4%
63.3%
20.2%
60.9%
39.1%
Plasterers and Stucco Masons
100.0%
982
16.7%
30.1%
51.2%
1.9%
96.8%
3.2%
Machine Feeders and Offbearers
100.0%
207
18.8%
46.9%
14.5%
19.8%
26.6%
73.4%
Paper Goods Machine Setters, Operators, and Tenders
98.9%
134
11.9%
5.2%
68.7%
0.0%
48.5%
51.5%
Pressers, Textile, Garment, and Related Materials
98.7%
804
12.3%
6.1%
54.2%
27.4%
70.3%
29.7%
Medical, Dental, and Ophthalmic Laboratory Technicians
98.5%
2,226
33.7%
20.7%
34.1%
9.8%
58.7%
41.3%
Sewing Machine Operators
97.9%
7,900
9.2%
2.5%
34.0%
53.1%
13.9%
86.1%
Miscellaneous Production Workers, Including Equipment Operators and Tenders
97.2%
12,044
25.7%
16.2%
40.9%
15.0%
67.5%
32.5%
Helpers, Production Workers
97.0%
2,080
14.1%
15.1%
55.6%
13.6%
83.0%
17.0%
Tailors, Dressmakers, and Sewers
96.5%
4,868
27.3%
13.9%
30.4%
27.5%
39.8%
60.2%
Grinding, Lapping, Polishing, and Buffing Machine Tool Setters, Operators, and Tenders, Metal and Plastic
95.3%
784
25.4%
11.0%
51.7%
8.2%
82.9%
17.1%
Photographic Process Workers and Processing Machine Operators
94.7%
1,270
48.8%
10.9%
16.5%
22.0%
77.5%
22.5%
Food Processing Workers, All Other
94.6%
872
31.4%
23.7%
32.6%
12.3%
68.3%
31.7%
Butchers and Other Meat, Poultry, and Fish Processing Workers
94.4%
3,967
14.7%
11.4%
65.2%
8.6%
90.1%
9.9%
Mail Clerks and Mail Machine Operators, Except Postal Service
93.7%
2,826
21.2%
36.3%
34.8%
6.5%
70.7%
29.3%
Miscellaneous Plant and System Operators
93.6%
186
36.0%
38.2%
25.8%
0.0%
73.7%
26.3%
Bakers
93.5%
6,929
17.8%
11.7%
51.2%
17.9%
69.6%
30.4%
Prepress Technicians and Workers
93.4%
560
52.1%
28.6%
11.8%
4.1%
73.8%
26.3%
Food Batchmakers
92.9%
1,381
14.4%
9.2%
53.5%
22.9%
32.6%
67.4%
Office Machine Operators, Except Computer
92.9%
980
20.4%
41.1%
29.7%
7.6%
60.1%
39.9%
Other Metal Workers And Plastic Workers
92.8%
1,801
30.1%
16.5%
40.4%
9.2%
90.8%
9.2%
Model Makers, Patternmakers, and Molding Machine Setters, Metal and Plastic
92.8%
139
45.3%
7.2%
38.8%
8.6%
61.9%
38.1%
Food and Tobacco Roasting, Baking, and Drying Machine Operators and Tenders
92.3%
118
64.4%
0.0%
35.6%
0.0%
43.2%
56.8%
Welding, Soldering, and Brazing Workers
91.9%
4,909
26.2%
21.3%
33.4%
12.6%
97.4%
2.6%
Extruding, Forming, Pressing, and Compacting Machine Setters, Operators, and Tenders
91.8%
89
59.6%
0.0%
40.4%
0.0%
83.1%
16.9%
The 25 Occupations with the Lowest Automation Potential
Occupation
Automation Potential
Total Employment
Share White
Share Black
Share Hispanic
Share Asian
Share Male
Share Female
Clergy
0.0%
7,515
44.6%
21.3%
12.2%
18.7%
80.7%
19.3%
Music Directors and Composers
0.0%
2,721
63.0%
8.6%
11.7%
15.1%
82.9%
17.1%
Religious Workers, All Other
0.0%
1,955
55.1%
22.1%
4.8%
18.0%
48.8%
51.2%
Dancers and Choreographers
0.0%
1,638
42.4%
31.0%
18.9%
2.9%
36.0%
64.0%
Directors, Religious Activities and Education
0.0%
1,274
72.6%
9.1%
13.0%
4.4%
41.2%
58.8%
Ambulance Drivers and Attendants, Except Emergency Medical Technicians
0.0%
923
36.3%
17.6%
35.5%
8.5%
96.1%
3.9%
Animal Trainers
0.0%
606
58.9%
0.0%
34.0%
0.0%
48.0%
52.0%
Athletes and Sports Competitors
0.0%
491
44.2%
20.4%
27.5%
7.9%
69.0%
31.0%
Actors
0.8%
6,788
70.5%
11.5%
12.2%
4.0%
55.5%
44.5%
Other Financial Specialists
1.0%
3,802
63.5%
4.0%
15.8%
15.8%
51.5%
48.5%
Purchasing Agents, Except Wholesale, Retail, and Farm Products
2.0%
5,934
60.3%
11.1%
17.7%
9.8%
45.6%
54.4%
Project Management Specialists
2.1%
24,397
62.8%
8.6%
10.1%
16.0%
54.0%
46.0%
Logisticians
2.1%
2,125
44.2%
13.4%
14.4%
26.4%
57.6%
42.4%
Training and Development Specialists
2.3%
2,514
48.1%
21.8%
17.4%
5.1%
50.4%
49.6%
Urban and Regional Planners
2.5%
871
65.9%
3.6%
8.4%
20.6%
59.4%
40.6%
Public Relations and Fundraising Managers
3.0%
4,203
75.4%
3.3%
9.0%
9.3%
27.9%
72.1%
Commercial and Industrial Designers
3.2%
1,836
60.7%
5.6%
7.6%
21.9%
55.8%
44.2%
Operations Research Analysts
3.5%
3,573
48.2%
15.2%
13.6%
17.2%
50.1%
49.9%
Chiropractors
3.5%
1,357
73.0%
1.5%
3.8%
13.4%
70.2%
29.8%
Entertainers and Performers, Sports and Related Workers, All Other
3.7%
2,287
59.9%
14.7%
21.6%
2.8%
55.6%
44.4%
Management Analysts
4.1%
39,287
62.6%
7.1%
9.4%
18.6%
58.8%
41.2%
Wholesale and Retail Buyers, Except Farm Products
4.6%
9,059
54.0%
13.7%
12.8%
16.4%
36.2%
63.8%
Budget Analysts
5.2%
1,931
39.8%
17.0%
11.4%
27.4%
45.3%
54.7%
Social and Community Service Managers
5.2%
20,399
51.4%
18.0%
18.3%
8.0%
35.1%
64.9%
Compensation, Benefits, and Job Analysis Specialists
5.7%
1,340
23.4%
26.6%
19.5%
28.2%
23.7%
76.3%
Automation Potential of Job Tasks Performed by NYC's Workforce, by Age and Race/Ethnicity/Sex
Group
Total
Age 18-24
Age 25-34
Age 35-44
Age 45-54
Age 55+
Male
39.6%
45.6%
38.4%
38.9%
40.5%
38.5%
Female
34.8%
41.8%
33.1%
33.8%
35.0%
34.7%
White
31.8%
37.2%
30.0%
30.6%
32.7%
32.7%
Black
39.4%
45.6%
39.3%
38.5%
39.1%
38.1%
Hispanic
43.8%
49.1%
44.0%
43.4%
42.9%
41.5%
Asian
39.3%
43.1%
35.0%
38.1%
42.5%
42.6%
Male
39.6%
45.6%
38.4%
38.9%
40.5%
38.5%
Female
34.8%
41.8%
33.1%
33.8%
35.0%
34.7%
Total
37.3%
43.6%
35.9%
36.7%
38.0%
36.7%
General operating support for the Center for an Urban Future has been provided by The Clark Foundation and the Bernard F. and Alva B. Gimbel Foundation.
Brooklyn Daily Eagle,
by Greg David and Suhail Bhat,
March 27, 2023
This report is a publication of the Middle Class Jobs Project, a research initiative made possible by the generous support of Fisher Brothers and Winston C. Fisher.