
School Funding in the Pandemic
Will States Step Up When Federal Covid Relief Runs Out?
Making the Grade provides an annual overview of the condition of school finance in the states. The data in this edition gives a picture of states’ investment in their public school systems in the 2019-20 school year, the historic moment when public education, and society at large, experienced the massive disruption brought on by a worldwide public health crisis.
In March 2020, the Covid-19 pandemic triggered an unprecedented shutdown of the nation’s public schools. Most schools transitioned to virtual learning for the remainder of the 2019-20 school year, and some school buildings were still closed through the fall of 2020 and longer. In response, school districts across the country scrambled to devise ways to continue educating and supporting their students.
Researchers continue to analyze and debate the fiscal impact of the pandemic on the nation’s public schools. This edition of Making the Grade demonstrates the failure of most states to have a system of school finance in place that would allow districts to effectively respond to the impact of the pandemic.
The pandemic exposed a stark reality to the nation: many schools, especially those in districts serving low-income communities, were not equipped to handle the task of continuing education in the midst of a public health crisis. The ability to effectively pivot to virtual instruction hinged on the availability of technology and high-speed internet access. Reopening schools safely depended on having modernized buildings with up-to-date HVAC systems and enough space to maintain social distancing guidelines. And when schools reopened, remediating learning delays and student trauma required access to adequate support staff and teachers while facing an acute shortage.[1]

In response to this crisis, Congress enacted multiple relief packages to address the impact of Covid on public schools. Much of these one-time allocations went directly to districts to spend on technology for remote learning and, later, building improvements and staff to bring students safely back into the classroom, make up for missed learning time, and provide social and emotional supports. Congress also allocated higher levels of relief to the nation’s low-wealth, high-poverty districts.
School districts are using federal Covid relief for a wide array of programs, services, and infrastructure needs – essential resources that should always be available. These resources include extended learning opportunities, greater social and emotional support, and other services needed by students year-in and year-out, not just during a pandemic.[2,3] Many districts are using federal relief to improve access to technology and make long overdue improvements to school buildings, including adequate heating and cooling.[4]
Covid relief is enabling many districts to address structural deficits caused by chronic state underfunding. But the question now is what will happen when districts spend down their federal pandemic relief? Inequitable state finance systems that caused the essential resource deficits laid bare by the pandemic will again come into focus. The temporary balm provided by Covid relief does not erase the pre-pandemic disparities in school funding documented in this report. Students in districts segregated by poverty and race will continue to be deprived of the same opportunities for school success as their peers in more affluent communities. It is also likely that critical supports for low-income students paid for with federal dollars, such as extended learning opportunities, intensive tutoring, and greater access to mental health services, will fade away along with the masks and hand sanitizer.
Federal Covid relief has provided some temporary relief from the underlying inequities in how schools are funded across the country. But the core challenge in public school finance remains just below the surface of the influx of federal funds. Lawmakers in statehouses must enact school finance reforms based on the actual cost of delivering the academic standards that students are required to achieve. If we fail to meet that challenge, the lessons of Covid-19 will be lost and, in short order, students and schools will be right back where they were when the pandemic struck.

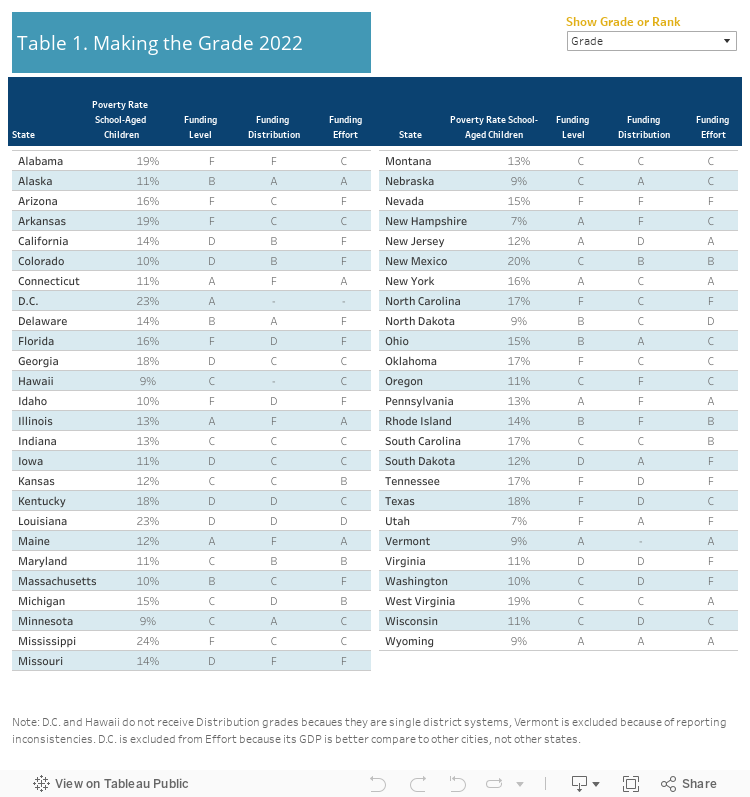
Making the Grade analyzes the condition of public school funding in all 50 states and the District of Columbia. Using the most recently available data from the 2019-20 school year, the report ranks and grades each state on three measures to answer the key question: How fair is school funding in your state?
The three fairness measure are:
- Funding Level – cost-adjusted, per-pupil revenue from state and local sources (Fig. 1a);
- Funding Distribution – the extent to which additional funds are distributed to school districts with high levels of student poverty (Fig. 2a);[5]
- Funding Effort – funding allocated to support PK-12 public education as a percentage of the state’s economic activity (GDP) (Fig. 3a).
The state rankings and grades on these measures provide crucial data to inform advocates, policymakers, business and community leaders, teachers, parents, and students about the equity and adequacy of public school funding in their state. Making the Grade is designed to assist state residents working to improve the level and distribution of funding for public school students.What Is Fair School Funding?
What Is Fair School Funding?
We define fair school funding as the funding needed in each state to provide qualified teachers, support staff, programs, services, and other resources essential for all students to have a meaningful opportunity to achieve a state’s academic standards and graduate from high school prepared for citizenship, postsecondary education, and the workforce. A fair funding system is the basic foundational building block for high-performing, effective, PK-12 public school systems. Fair funding has two basic components: a sufficient level of funding for all students and increased funding for high-poverty districts to address the additional cost of educating students in those districts. These two components are dependent on a third factor: the effort made by state lawmakers to raise sufficient revenue to support the public schools to meet state-established curriculum content and performance objectives.
Why the States?
Unlike other countries, the United States has no national education system. Instead, states, under their respective constitutions, have the obligation to support and maintain a system of free public schools for all resident children. The states, and not local school districts or the U.S. Congress, are the unit of government legally responsible for operating the nation’s public schools and providing the funding necessary to support and maintain those schools.
All states fund their schools through a statewide method or formula enacted by the state legislature. These school funding formulas, or school finance systems, determine the amount of revenue school districts are permitted to raise from local property and other taxes and the amount of funding or aid the state is expected to contribute from state taxes. In annual or biannual state budgets, legislatures also determine the actual amount of funding districts will receive to operate their schools. Several states, including New Jersey, Pennsylvania, and Illinois, fail to provide in their budgets the amount of state aid required by the state’s own funding formula, a condition called formula underfunding.
State and local revenues account for, on average, approximately 92% of total funding for public education. The federal government, primarily through programs targeted for low-income students and students with disabilities, contributes the remaining 8%.[6]
Why Does Fair School Funding Matter?
A fair, equitable, and adequate school funding formula is the basic building block of a well-resourced and academically successful school system for all students. A strong funding foundation is even more critical for low-income students, students of color, English learners, students with disabilities, and students facing homelessness, trauma, and other challenges. These students, and the schools that serve them, need additional staff, programs, and supports to put them on the same footing as their peers. Research on the needs of vulnerable student populations for extra academic and academically-related programs and services is compelling, as is growing evidence that increased investments in these students improves academic achievement and other outcomes.[7]

This report utilizes national data sets to analyze the condition of school funding in the states.
Data Sources The U.S. Census Bureau’s Annual Survey of School System Finances (2008-2020), the U.S. Census Bureau’s Small Area Income and Poverty Estimates (2008-2020), and the U.S. Bureau of Economic Analysis’ State Gross Domestic Product reports (2008-2020).
Funding Level is determined by dividing state and local revenue by student enrollment. Federal revenue is not included, except for Impact Aid and Native American education revenue, as they are intended to replace state and local funds. We also exclude revenue for capital outlay and debt service programs. These revenues tend to be uneven from year to year, and one-time or short-term investments may obscure more prevalent funding patterns. Finally, district-level payments to charter schools, private schools, and other school systems that are reported as expenditures are subtracted from the revenue total. These revenues are attributable to students not included in the enrollment count. The resulting per-pupil funding levels are adjusted for regional differences using the National Center for Education Statistics’ Comparable Wage Index for teachers.
Funding Distribution utilizes a modified version of the regression-based method developed by Bruce Baker and published in Is School Funding Fair? A National Report Card (eds 1-7) to model the pattern of funding relative to district poverty within each state. The analysis essentially asks, once differences in costs related to district size and geography are accounted for, do states provide more or less funding to districts as the poverty rate increases? Using district-level revenue data (as defined above for funding level), the model predicts funding in a high-poverty (30% Census poverty) relative to a low-poverty (5% Census poverty) district. States that provide higher per-pupil funding levels to high-poverty districts are progressive; states that provide less to high-poverty districts are regressive; and states where there is no meaningful difference are flat.
Funding Effort is measured as total state and local revenue (including capital outlay and debt service, excluding all federal funds) divided by the state’s gross domestic product (GDP). GDP is the value of all goods and services produced by each state’s economy and is used here to represent the state’s economic capacity to raise funds for schools.
Grades are assigned using the typical curve. A standardized score is calculated as the state’s difference from the mean or average, expressed in standard deviations. Grades are as follows: A = 2/3 standard deviation above the mean; B = between 1/3 and 2/3 standard deviations above the mean; C = between 1/3 standard deviation below and 1/3 standard deviation above the mean; D = between 1/3 and 2/3 standard deviations below the mean; F = 2/3 standard deviation below the mean.
For more details on report methodology, see the Technical Appendix.
The Fairness Measures
Funding Level
A state’s funding level is measured by analyzing the combined state and local revenues provided through the state school finance formula, adjusted to account for regional variations in labor market costs.
A state’s funding level grade is determined by ranking its position relative to other states; the grade does not measure whether a state meets any particular threshold of funding adequacy based on the actual cost of education resources necessary to achieve state or national academic standards. [8]
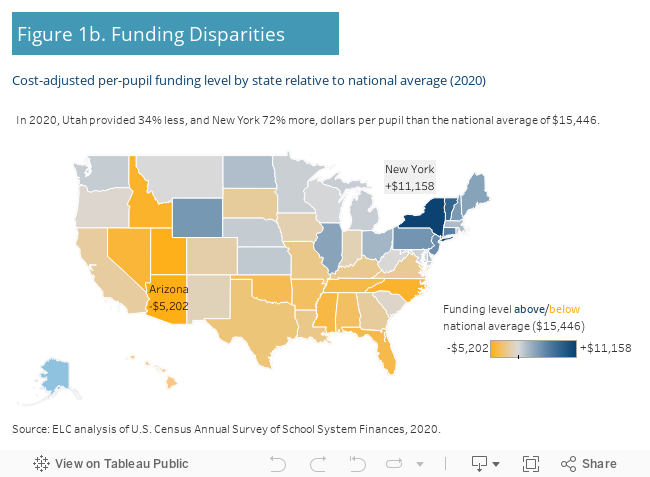
Figure 1a shows the extreme divergence in school funding levels across states, even after adjusting for regional cost differences, with the top states providing upwards of 50% more and the bottom states providing 30% less than the national average funding level of $15,446 per pupil. Figure 1b shows a clear geographic pattern, with states in the Northeast and Midwest generally having higher funding levels than those in the South and West.
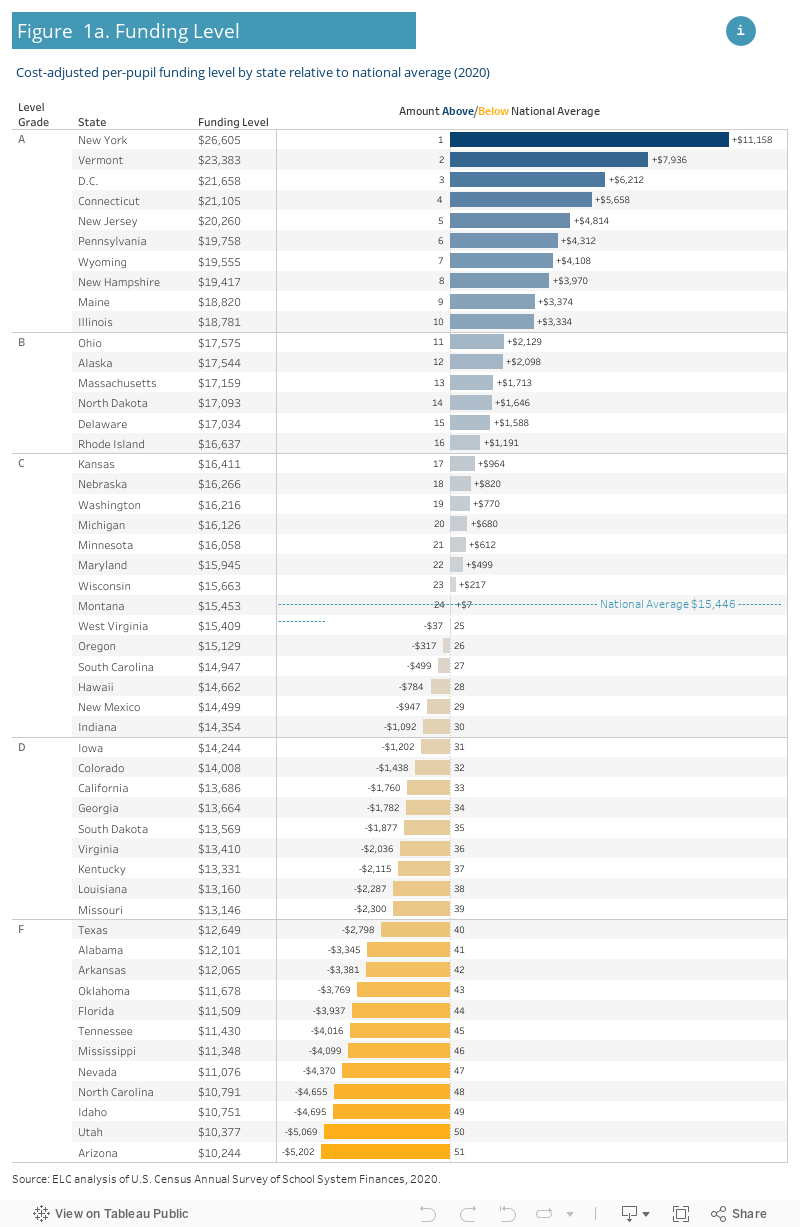
Funding Level Over Time
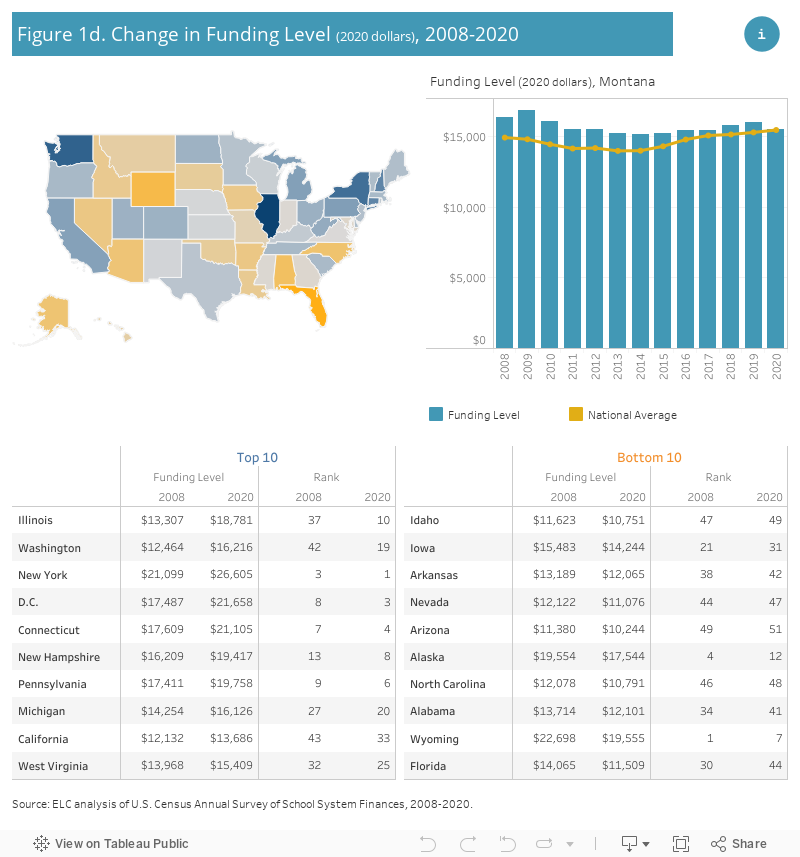
Figure 1c shows the change in each state’s funding level rank between 2008 and 2020.[9] While the majority of states remain relatively stable, moving five or fewer rankings up or down, some states stand out. On the positive side, Illinois, Washington, and California all climbed double-digits in their rankings between 2008 and 2020. In Illinois, that meant moving from a D to an A rating, while Washington and California went from Fs to a C and D, respectively. On the opposite spectrum, six states fell in ranking by ten or more spots. The largest declines were in Montana (B to C) and Florida (C to F) which both fell by 14 spots.
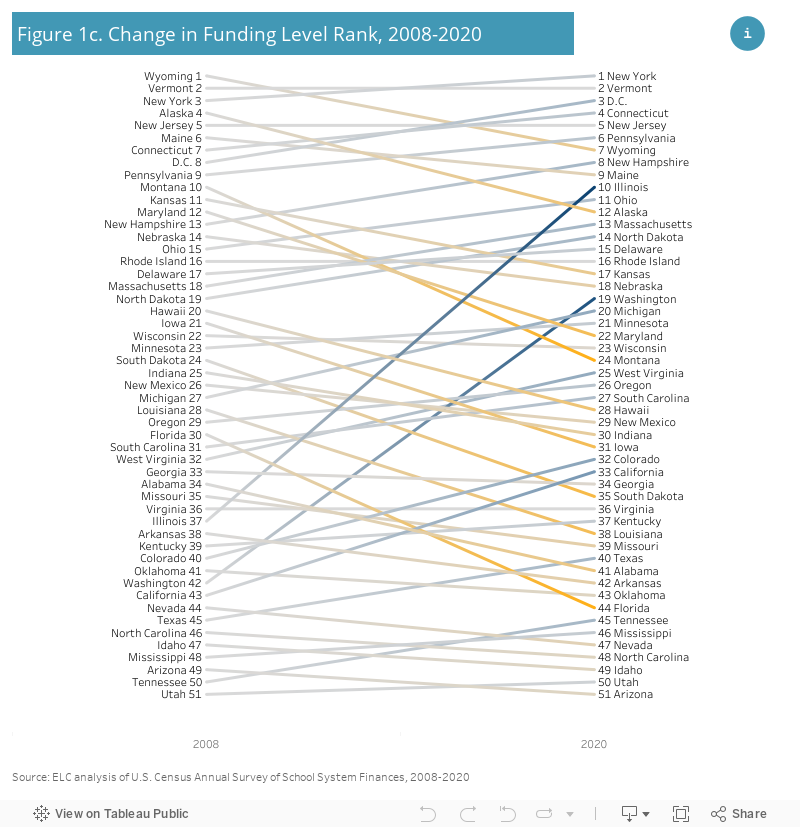
The change in relative rank illustrates whether states followed or bucked national trends in funding over this period, but the rankings can mask gains or losses in per-pupil funding within states. For example, when comparing inflation-adjusted funding levels between 2008 and 2020, we find that some states had large percentage gains in per-pupil funding levels, even if their rank did not significantly change (Fig. 1d). States such as New York, Connecticut, and Pennsylvania all saw well above average increases in per-pupil funding, but because they were already ranked relatively high, they did not see much movement relative to other states. On the other hand, states such as North Carolina, Arizona, and Nevada, already bottom-ranked, decreased funding when compared with 2008, after adjusting for inflation. For example, North Carolina’s funding levels are down 10% from 2008, though its rank only fell from 46th to 48th overall. See Appendix Table A1 for funding level changes in all states.
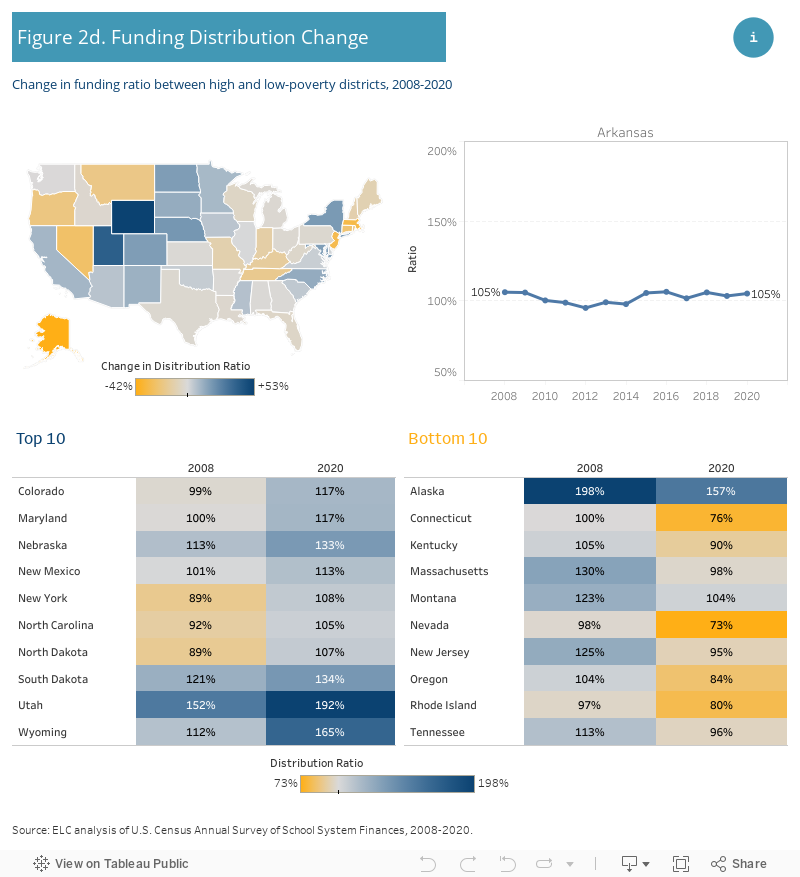
Funding Distribution
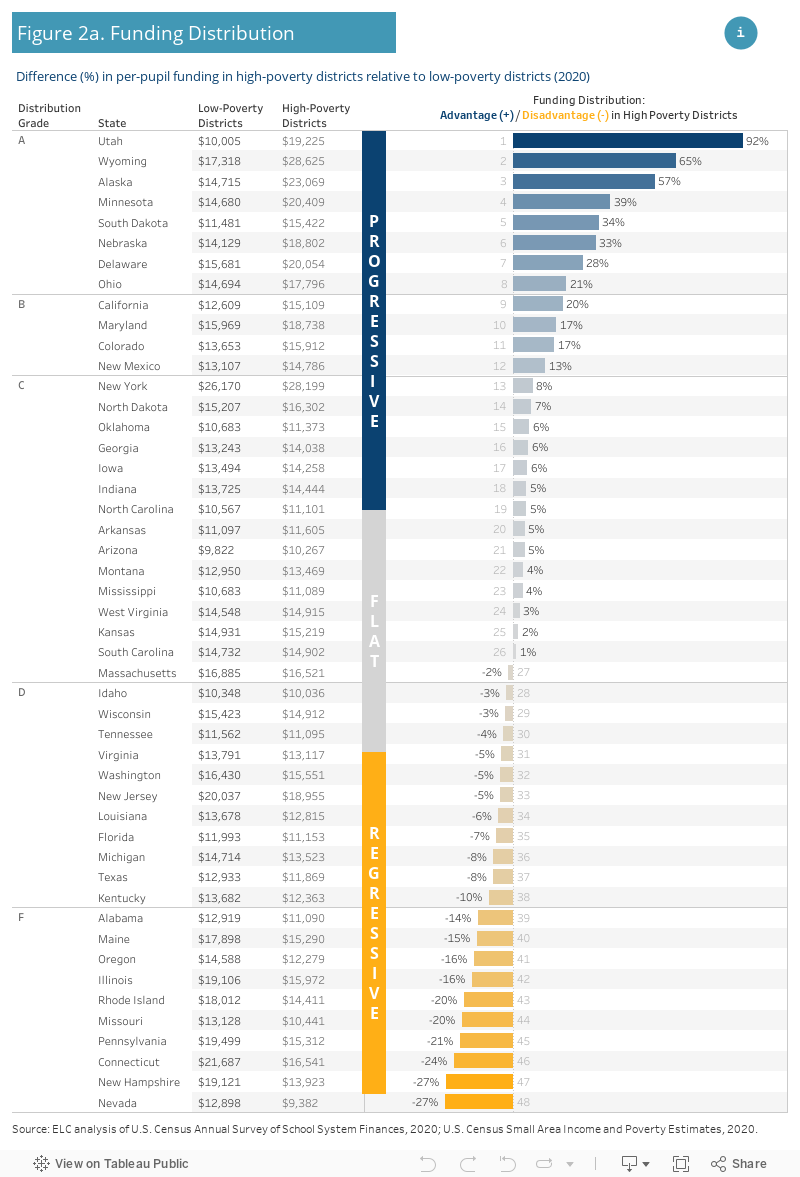
The hallmark of a fair and equitable school finance system is that it delivers more funding to educate students in high-poverty districts.[10] This means states providing equal or less funding to high-poverty districts are shortchanging the students most in need of additional resources for academic success. A central feature of fair school funding is providing higher levels of funding to districts serving large concentrations of students from households with incomes below the federal poverty line.
Figure 2a depicts funding distribution in each state as measured by the funding allocated to high-poverty districts relative to low-poverty districts. States allocating more per-pupil funds to high-poverty districts have a “progressive” distribution system, resulting in a higher grade on the funding distribution measure. States that do the opposite have a “regressive” distribution system and earn a lower grade. States with similar funding levels in high- and low-poverty districts have “flat” distribution systems, clustered in the C grade range.
As with funding level, states are highly divergent in terms of the progressivity of their funding distribution. Three states – Utah, Wyoming, and Alaska – provide more than 50% more funding to high-poverty districts, while New Hampshire and Nevada provide 27% less.
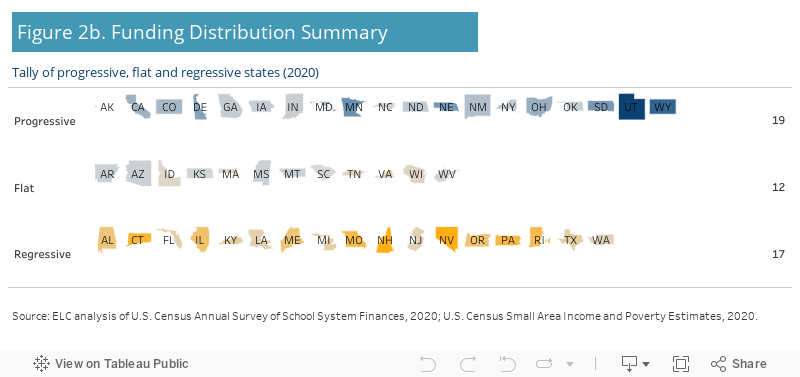
Only 19 states have even modestly progressive school funding systems with at least 5% more funding, on average, in high-poverty districts. School funding is flat (+/-5%) in 12 states, meaning there is no appreciable increase in funding to address the need for additional resources in high-poverty districts. The remaining 17 states have regressive funding systems, i.e., they provide less funding to their poorest districts (Fig. 2b).
Funding Distribution Over Time
The number of progressive, flat, and regressive states fluctuates slightly from year to year. Typically, about one-quarter to one-third of states are classified as progressive, though that increased slightly in 2019 and 2020 (Fig. 2c). Within these national trends, there has been some significant movement, both positive and negative, among individual states.
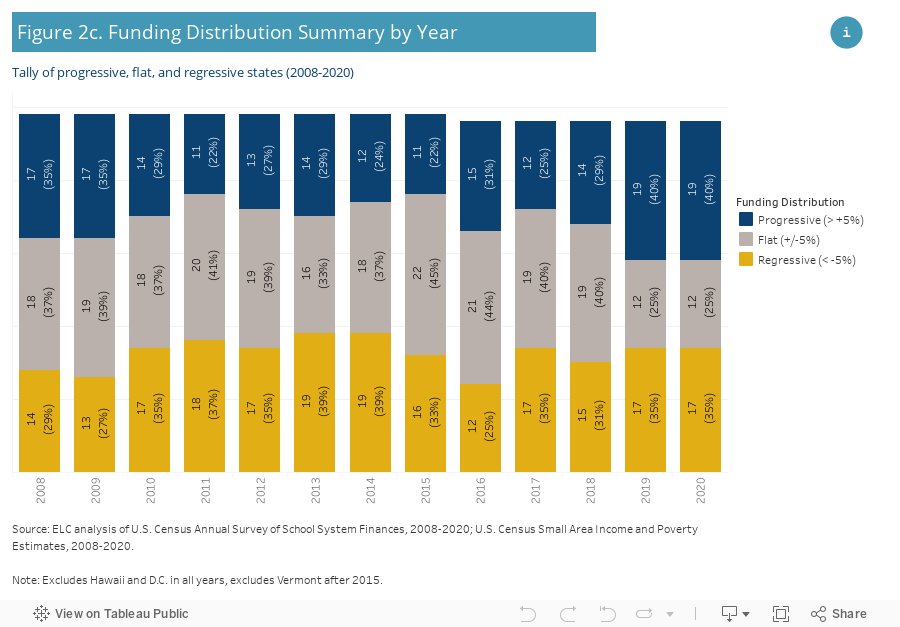
Figure 2d shows the ten states with the most improved funding distribution between 2008 and 2020:
- Four progressive states became substantially more progressive: Wyoming, Utah, Nebraska, and South Dakota.
- Three flat states became at least mildly progressive: Colorado, Maryland, and New Mexico.
- Three regressive states became mildly progressive: New York, North Dakota, and North Carolina.
Among the ten states with the least improved funding distribution between 2008 and 2020:
- Four progressive states became flat: Massachusetts, New Jersey, Montana, and Tennessee.
- Five flat states became regressive: Nevada, Connecticut, Oregon, Rhode Island, and Kentucky.
- Alaska became less progressive.
See Appendix Table A2 for funding distribution changes in all states.
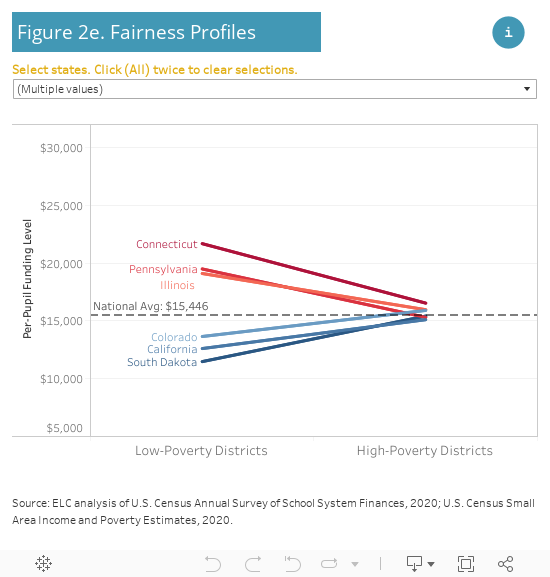
Fairness Profiles
The fairness of a state’s school funding system is contingent on both adequate funding levels and a progressive distribution of funds. Some seemingly well-resourced states, such as Illinois, Connecticut, and Pennsylvania, do a poor job of targeting those funds where they are most needed, leaving large disparities in average funding levels of the highest and lowest poverty districts. Likewise, some states with a progressive distribution, such as South Dakota, California, and Colorado, have low overall funding levels that leave even their highest poverty districts with funding that just barely reaches the national average (Fig. 2e).

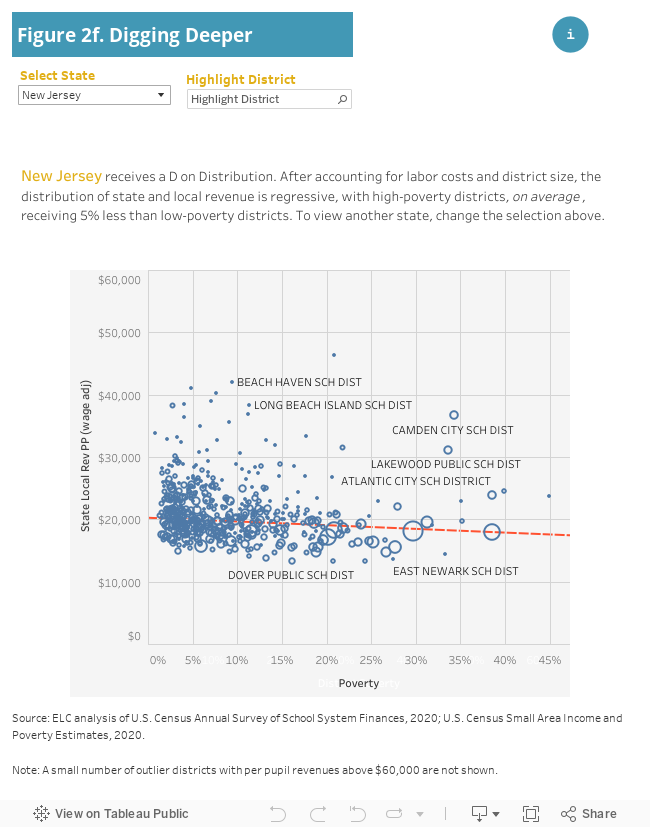
The funding distribution measure uses district-level data to determine a state’s overall pattern of school funding. It is important to recognize that this measure may not capture the variations in a complex system. There will inevitably be districts (e.g., poorly funded, high-poverty districts in an otherwise progressive state) that do not match the statewide pattern presented here. Figure 2f illustrates both the wage-adjusted district level data (blue circles) and the estimated relationship between funding and poverty in the state (red line). This graph provides important context as to how well individual districts fit the overall state pattern.
There is no substitute for more detailed analysis of the conditions in states that influence the distribution of funding. Such an analysis is beyond the scope of this report, but the findings presented here can serve as a starting point for deeper research and discussion of the need for finance reform. See examples of our state-specific work here.
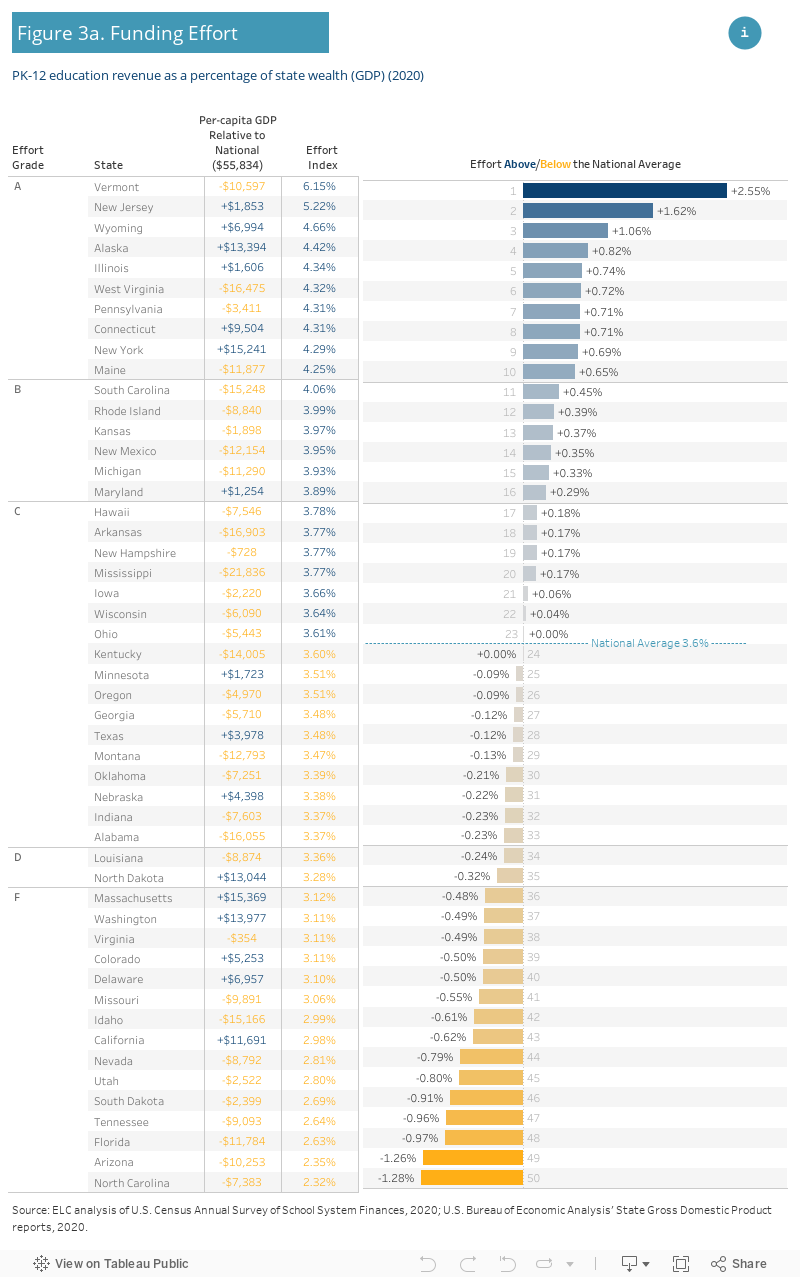
Funding Effort
Figure 3a ranks states on effort as measured by the percentage of the state’s economic activity, or gross domestic product (GDP), allocated to support the PK-12 school system.[11] It is important to consider a state’s effort index in the broader context of their overall economic wealth. Consider New Hampshire and Mississippi: both states receive a C with slightly above average effort, but they have vastly different per capita GDPs. Though they are making a similar effort to fund schools, New Hampshire is doing so in the context of an average size economy, where per capita GDP is at the national average, while Mississippi is doing so in a small economy, where per capita GDP is 39% below the national average. With the same effort, New Hampshire receives an A for funding level, and Mississippi receives an F. Figure 3a also juxtaposes a state’s relative effort compared to the national average with its per capita GDP to contextualize how the effort index interacts with the state’s relative wealth to produce high or low funding levels.
It is also important to recognize that the effort index reflects both state and local funding as a percentage of GDP at the state level. A high effort index does not mean funding is distributed equitably across districts within the state. In fact, many of the highest effort states receive an A on funding level and an F on funding distribution (Illinois, Pennsylvania, Connecticut, and Maine). In these states, the high funding levels, driven by local property taxes, are disproportionately concentrated in the state’s lowest poverty districts, while the highest poverty districts are left with less.
Effort Index Over Time
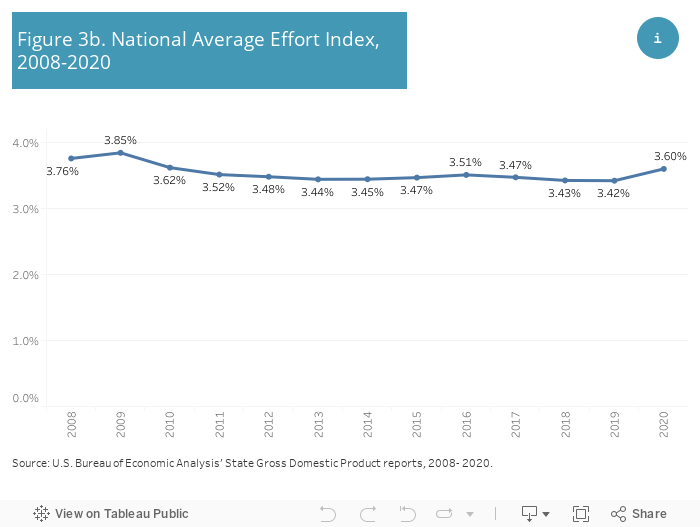
Due to state disinvestment in education after the 2008 Great Recession, the national average effort index hovered around 3.4-3.5% from 2011 to 2019, down from 3.76% in 2008 (Fig. 3b). Even as the economy rebounded, most states did not increase PK-12 education spending in proportion to gains in GDP, keeping the effort index low.[12] The effort index increased to 3.60% in 2020, though this is due to diverging trends in the initial phase of the pandemic, where education spending, which usually lags behind overall economic trends, increased at the same time as GDP fell.
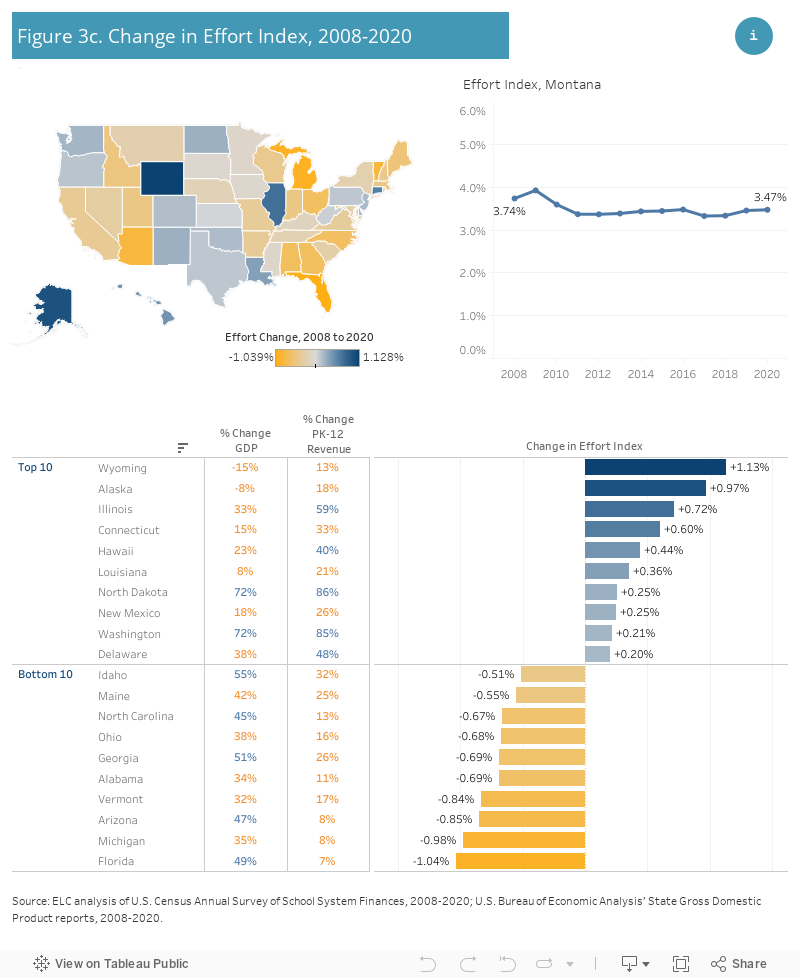
In states that saw the largest increase in the effort index, education funding outpaced growth in GDP. States with the greatest losses saw the opposite – education funding increased at a slower pace than GDP. Notably, several states with the highest gains in effort had above average increases in education funding even though their overall economy grew at a slower pace than the national average. Illinois, Hawaii, and Delaware prioritized school funding, even through a slow economic recovery. On the other hand, some states with the largest declines in effort had below average increases in education funding, despite average or above average growth in GDP (Idaho, North Carolina, Georgia, Arizona, and Florida). These states disinvested in education even while experiencing a healthy economic recovery (Fig. 3c). See Appendix Table A3 for funding effort changes in all states.
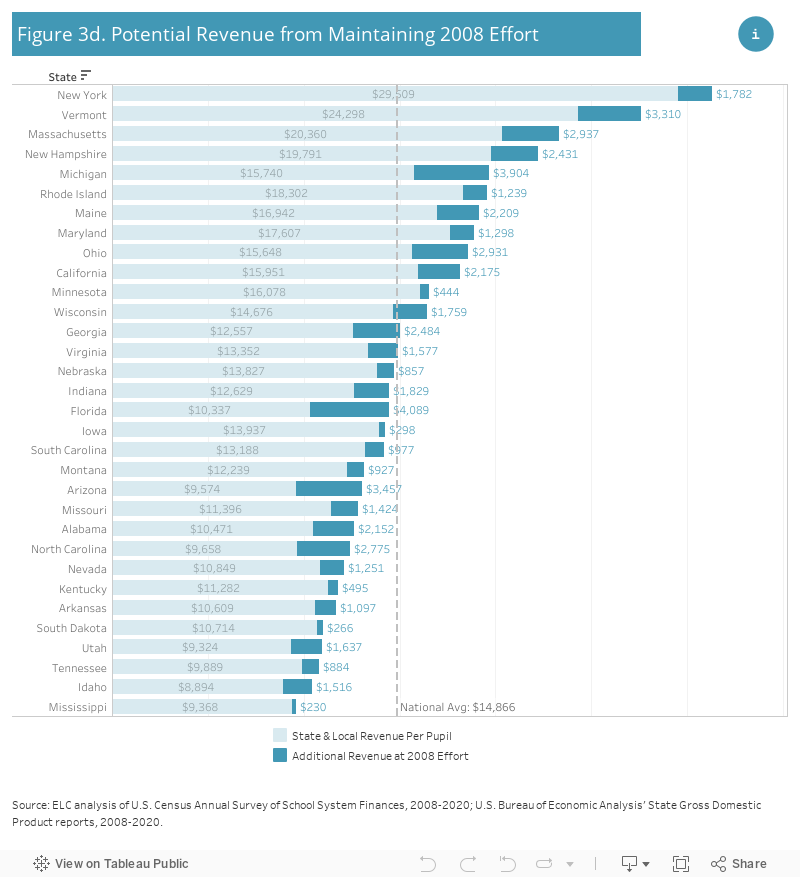
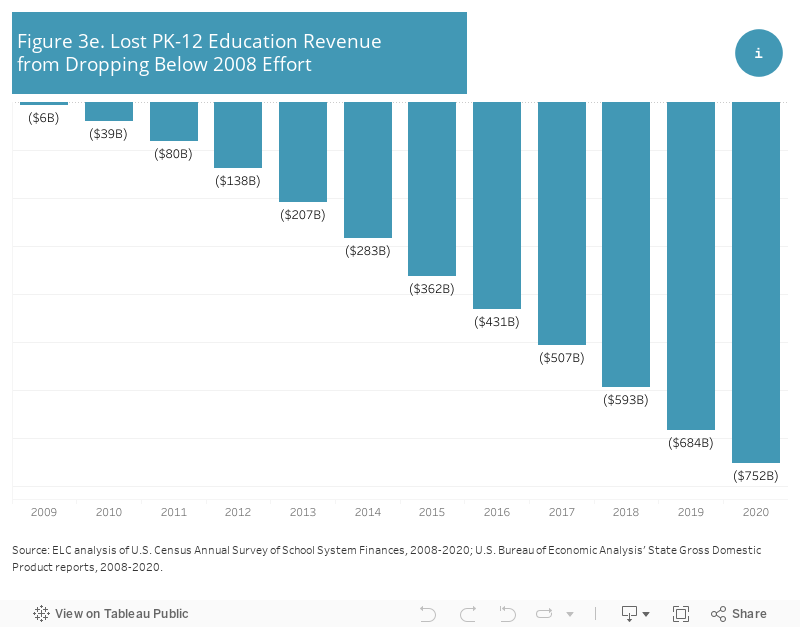
To illustrate the impact of states’ declining effort to fund their public school systems, Figure 3d shows the difference in per-pupil funding if states had maintained their pre-Recession level of effort.[13] Thirty-two states would have generated more funding for their schools if they had maintained their fiscal effort from 2008. Thirteen states would have increased funding levels by more than $2,000 per-pupil over current levels, including five states with funding well below the national average (Georgia, Florida, Arizona, Alabama, and North Carolina). In total, reduced state effort on education funding resulted in a loss of $752 billion in state and local funding between 2009 and 2020[14] (Fig. 3e).

During the Great Recession, states used federal stimulus dollars to prop up their education budgets. When those federal funds ran out, states were left with large budget holes. In many cases, states resorted to massive state aid cuts that disproportionately affected high-poverty districts. Many states took years to return to pre-Recession levels of investment, and some still have not.[15]
The risk is similar with the infusion of federal Covid relief in schools. States and school districts are using federal funds to invest in staff, programs, and services they otherwise could not afford. In addition, Congress required that these funds supplement – rather than supplant – existing levels of state and local revenues. Since expected declines in state tax revenues as a result of the pandemic did not materialize, some states are using surpluses to invest in schools and other social programs, while others are using those revenues to cut taxes.[16] Nevertheless, when the federal funds are depleted, districts will either need additional revenue to continue increased levels of student support, or they will be forced to cut essential staff, programs and services for students.
The progressive distribution of federal pandemic relief means that high-poverty districts receiving higher levels of federal aid have the most to lose. Some high-poverty districts across the country are using federal funds to provide extensive academic supports to help students catch up, though others are forced to prioritize remediation of longstanding deficiencies in school facilities or are otherwise constrained in spending due to teacher and support staff shortages. There is compelling evidence that academic and social-emotional interventions should be sustained for the long haul, both because students have returned to school with significant issues and so that schools can finally close persistent achievement gaps by race and poverty.[17] Similarly, the pandemic has taught us that schools should not be forced to choose between academic supports and safe and modern facilities.[18]
The lesson is clear: advocacy is needed to press state lawmakers to ensure students – who, through one-time Covid relief funding are finally getting access to some of the resources they need and are entitled to – continue to receive those supports. States can maximize the return on the pandemic relief by increasing their own investments to enable districts to sustain and continue the progress now underway.
The 2022 Midterms:
Momentum for Reform?
State lawmakers are legally obligated to maintain and support – i.e., fund – their public school systems. This means that school finance reform can only be achieved through political campaigns focused on legislators and governors in statehouses across the country. We know from our research on successful school funding reforms that these state-based campaigns must utilize multiple strategies, from research to grassroots organizing, communications, and, where feasible, litigation.[19]
There is growing evidence that the fight to preserve and strengthen public education is gaining steam in the states – where it matters most. Recent results from the 2022 midterm elections offer some striking examples of how grassroots advocacy and sustained political campaigns can secure meaningful wins to improve funding, resources, and opportunity for the nation’s public school students.

In Massachusetts, voters approved a ballot measure, the Fair Share Amendment, that creates a surcharge on incomes over $1 million. This “millionaire’s tax” is expected to generate over $2 billion a year, and the revenue raised is earmarked for education and transportation.[20] The Fair Share for Massachusetts campaign secured this win through research, advocacy and statewide organizing that focused on building more equitable schools and communities.[21]
In New Mexico, voters overwhelmingly approved a ballot measure to guarantee the right to early childhood education in the state’s constitution. The amendment obligates an additional 1.25%, on top of the existing 5%, to be withdrawn annually from the Land Grant Permanent Fund, a trust fund that will provide approximately $150 million for early childhood education and another $100 million for K-12. This victory was the culmination of more than a decade of advocacy grounded in research on the educational and social-emotional benefits of early education and, more recently, a political campaign to elect more “champions of equity” in the state legislature.[22]
According to the Education Commission of the States, the 2022 elections included a total of seven education-related ballot measures.[23] Five of the seven were related to PK-12 funding, and all five passed. In addition to the measures mentioned above, California voted to increase arts and music education funding by $1 billion annually; Colorado voted for universal free school meals; and New Mexico voted in favor of authorizing bonds for school facilities projects.
In other states, the elections have shifted political power in the direction that will likely yield increased state investment in public education. In Michigan, Democrats now hold majorities in both the House and the Senate, paving the way for the governor’s progressive education agenda in her second term.[24] Maryland, Massachusetts, and Pennsylvania elected governors who pledged to support and expand school finance reforms that have stalled under previous administrations. Kansas re-elected a staunchly pro-public school governor who has championed the cause of school funding reform in that state.
Public education remains the “ultimate states right” in the United States. This means that school finance reform will be won or lost politically in the statehouse, not with local school boards or in Congress. The recipe for political success is clear: a combination of research, grassroots organizing, and communications all working together toward a common goal. With this combination of tools, it is possible to secure from state lawmakers the reforms necessary to provide every student in every school with the educational opportunities they deserve and are constitutionally entitled to.
Endnotes
[1] Sutcher, L., Darling-Hammond, L., and Carver-Thomas, D. (2016). A Coming Crisis in Teaching? Teacher Supply, Demand, and Shortages in the U.S. Palo Alto, CA: Learning Policy Institute. https://doi.org/10.54300/247.242.
[2] Duncombe, C. and Syverson, E. (2022). Innovative Ways States Are Using ESSER Funds. EdNote. Education Commission of the States. https://ednote.ecs.org/innovative-ways-states-are-using-esser-funds/
[3] Darling-Hammond, L. et al. (2020). Restarting and Reinventing School: Leaning in the Time of COVID and Beyond. Palo Alto, CA: Learning Policy Institute. https://restart-reinvent.learningpolicyinstitute.org/
[4] Reid, A. (2022). How Schools Are Spending Unprecedented Education Relief Funding. Denver, CO: National Conference of State Legislators. https://www.ncsl.org/research/education/how-schools-are-spending-unprecedented-education-relief-funding-magazine2022.aspx
[5] This measure does not include figures for Hawaii and the District of Columbia which operate as single district systems. Vermont is also excluded because of reporting inconsistencies. See the Technical Appendix for more information.
[6] Cornman, S.Q., Phillips, J.J., Howell, M.R., and Zhou, L. (2022). Revenues and Expenditures for Public Elementary and Secondary Education: FY 20 (NCES 2022-301). U.S. Department of Education. Washington, DC: National Center for Education Statistics. https://nces.ed.gov/pubs2022/2022301.pdf
[7] McKillip, M. and Luhm, T. (2020). Investing Additional Resources in Schools Serving Low-Income Students. Newark, NJ: Education Law Center. https://edlawcenter.org/assets/files/pdfs/publications/Investing_in_Students_Policy_Bri.pdf
[8] The United States has no established “opportunity to learn” standards that define the resources needed to ensure students have the opportunity to achieve common outcomes. It is, therefore, not feasible to determine the cost of those resources and funding levels across states.
[9] We chose 2008 as a base year for comparison to avoid any fluctuations in school funding levels dependent on 2008’s Great Recession. Because wider economic disruptions tend to affect school budgets on a lag, 2008 provides a picture of school funding before the economic downturn affected school budgets.
[10] Poverty is measured using the Census definition due to reporting inconsistencies for the National School Lunch Program, the more commonly used metric of school poverty. Census poverty is a more severe measure than either free lunch (130% of Census poverty) or reduced lunch (185%) eligibility. We define high-poverty districts as having a 30% Census poverty rate among school-aged children and low-poverty districts having a 5% poverty rate. For more detail, see the Technical Appendix.
[11] Gross domestic product (GDP) is the value of all goods and services produced by each state’s economy. In this report is serves as a measure of each state’s capacity to raise revenue to fund schools.
[12] Farrie, D. and Sciarra, D.G. (2021). $600 Billion Lost: State Disinvestment in Education Following the Great Recession. Newark, NJ: Education Law Center. https://edlawcenter.org/research/$600-billion-lost.html
[13] Because the effort measure uses all state and local funds, including capital, in the calculation of the index, that is the basis for the per-pupil funding presented here. Funding is also not adjusted for regional differences as the comparison is focused on within state differences in funding. As such, these per-pupil funding levels do not match the adjusted levels used in the funding level comparisons.
[14] We follow the same analysis as used in the $600 Billion Lost report, but get slightly different results due to updated GDP and state and local revenue data.
[15] Leachman, M., Masterson, K. and Figueroa, E. (2017). A Punishing Decade for School Funding. Washington, D.C.: Center on Budget and Policy Priorities. https://www.cbpp.org/research/state-budget-and-tax/a-punishing-decade-for-school-funding
[16] Lazere. E. (2022). States With Temporary Budget Surpluses Should Invest in People, Not Enact Permanent Tax Cuts. Washington, D.C.: Center on Budget and Policy Priorities. https://www.cbpp.org/research/state-budget-and-tax/states-with-temporary-budget-surpluses-should-invest-in-people-not
[17] For example, see Johnson, R. and Tanner, S. (2018). Money and Freedom: The Impact of California’s School Finance Reform. Palo Alto, CA: Learning Policy Institute; Rothstein, J. and Schanzenbach, D.W. (2021). Does Money Still Matter? Attainment and Earnings Effects of Post-1990 School Finance Reforms. Cambridge, MA: National Bureau of Economic Research. https://www.nber.org/papers/w29177
[18] Filardo, M. (2021). 2021 State of Our Schools: America’s PK-12 Public School Facilities. Washington, D.C.: 21st Century School Fund https://static1.squarespace.com/static/5a5ccab5bff20008734885eb/t/618aab5d79d53d3ef439097c/1636477824193/SOOS-IWBI2021-2_21CSF+print_ final.pdf
[19] Sciarra, D. and Dingerson, L. (2021). From Courthouse to Statehouse – and Back Again. Newark, NJ: Education Law Center. https://edlawcenter. org/assets/files/pdfs/School%20Funding/ELC_Report_Courthouse_to_Stateho.pdf
[20] Guzman, M. (2022). Massachusetts Voters Score Win for Tax Fairness with ‘Fair Share Amendment.’ Washington, D.C.: Institute on Taxation and Economic Policy. https://itep.org/massachusetts-voters-score-win-for-tax-fairness-with-fair-share-amendment/
[21] See Yes on 1, Fair Share Massachusetts, https://www.fairsharema.com/
[22] Cohen, R. (2022). New Mexico just voted to make pre-K a universal right. Vox. https://www.vox.com/policy-and politics/2022/10/18/23404090/new-mexico-election-result-child-care-early-childhood-prek
[23] Moore, J. and Pechota, D. (2022). 2022 Election Outcomes and Implications for State Education Policy. EdNote. Education Commission of the States. https://ednote.ecs.org/2022-election-outcomes-and-implications-for-state-education-policy/
[24] Mauriello, T. (2022). Tutoring and teacher retention top Whitmer’s education agenda as she seeks second term. Detroit, MI: Chalkbeat. https://detroit.chalkbeat.org/2022/10/13/23402664/gretchen-whitmer-education-priorities-second-term-tudor-dixon-michigan-governor