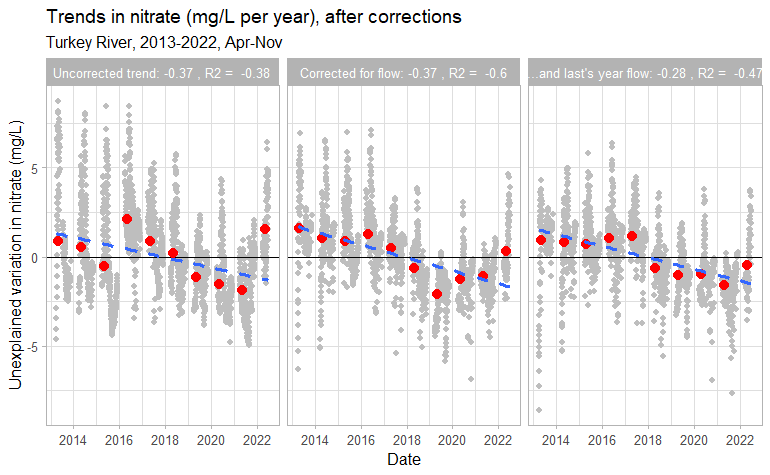
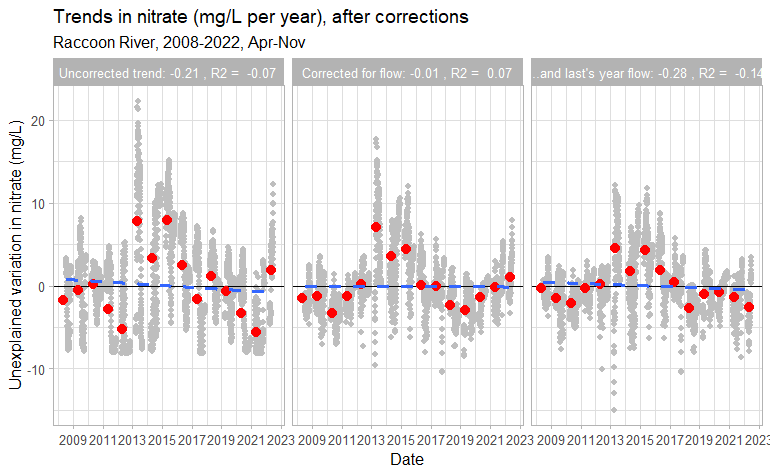
We know that weather influences water quality in Iowa’s rivers. Last year, there was a drought and nitrate was lower than usual. This spring, it’s been wetter and nitrate is higher than usual. If you monitor for 10 years and the first 5 are a little wetter or drier than the last five, you’ll a water quality trend to go with it. Boring!
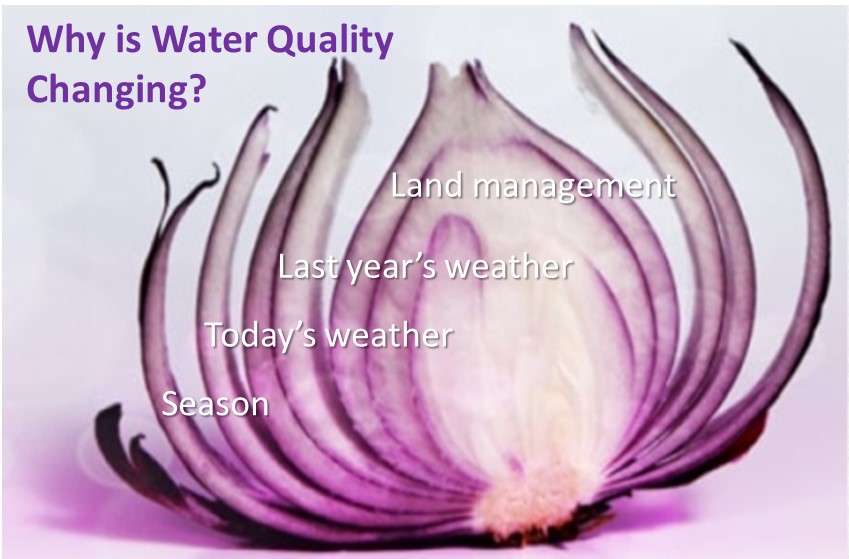
What we really want to know is how people are influencing water quality. We can get a lot closer to that answer by peeling away the obvious weather-related patterns to reveal underlying trends.
In statistics, it’s called a covariate or an explanatory variable. If there’s a relationship between your water quality metric and some other thing you’re not really interested in (i.e. streamflow), you can model that relationship to account for part of a water quality trend over time. What’s left over might be the things you’re really interested in (i.e. how water quality has been affected by changes in crop rotations, conservation practices, sewage treatment, manure management, and drainage). It’s common enough in the scientific literature (Robert Hirsch’s Weighted Regression on Time, Discharge, and Season is a good example), but should be used more often for progress tracking at the watershed scale.
To illustrate this general approach, I downloaded daily nitrate data from three stations maintained by the US Geologic Survey. The sensors at the Turkey River at Garber and the Cedar River near Palo (north of Cedar Rapids) were installed in late 2012; the sensor Raccoon River near Jefferson was installed in 2008. I wanted a high frequency dataset (to minimize sampling error) that included the episodes of “weather whiplash” in 2013 and 2022.
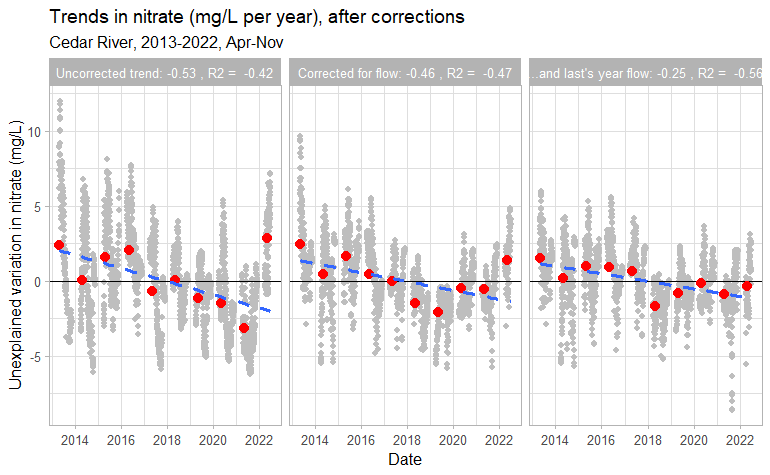
“Residuals” are the difference between what we predict and what we measured. In the first panel, that’s the difference between a measurement and the long-term average. In the second and third panels, we see how nitrate measurements differ from what we’d expect given flow in the stream today, and flow in the stream last year. Gray dots – daily measurements. Red dots- yearly averages. Blue dotted line – trend. If I did this right, some of the dots should get closer to the middle.
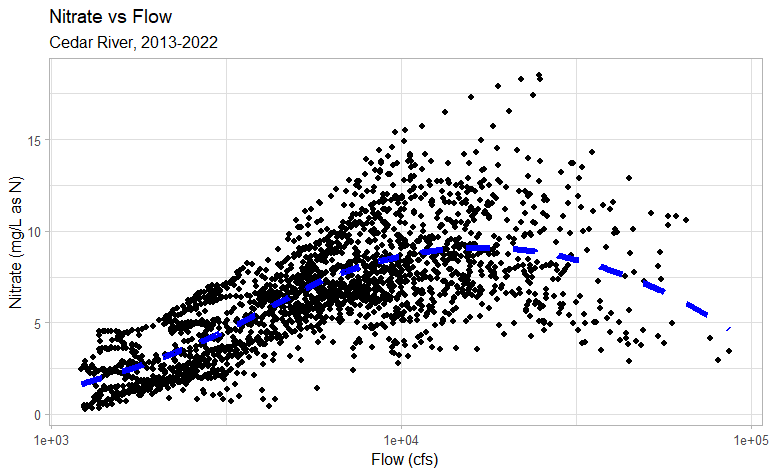
Nitrate concentrations in rivers increase as the weather gets wetter and streamflow increases… up to a point. When rivers are running very high, there’s a dilution effect and nitrate concentrations fall. Based on that relationship, we can explain high nitrate levels in the Cedar River in 2016 (a wet year) and low nitrate levels in 2021 (a dry year).
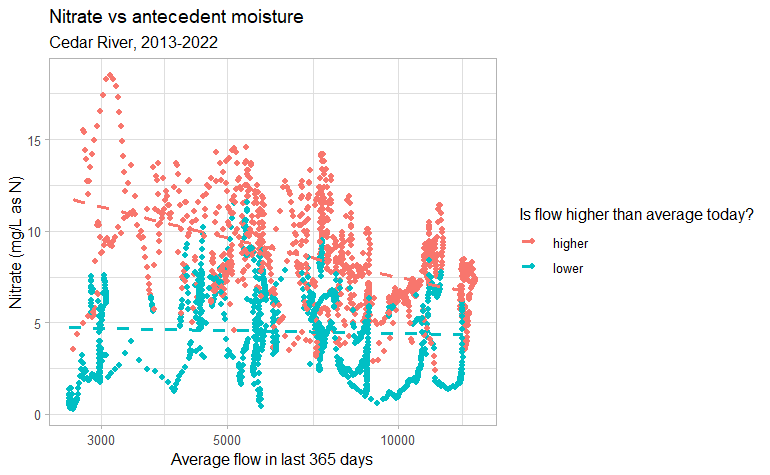
Nitrate concentrations tends to be highest on wet spring days following a dry summer and fall, as nitrate that accumulated in the soil during the drought is flushed into drainage systems or washed off the land surface and into rivers. Here I’ve calculated a moving average of flow over the previous 365 days, and compared that to nitrate concentrations during high flow or low flow conditions. Based on that relationship, we can explain high nitrate in the Cedar River on wet days in the spring of 2013 and 2022 (following a dry year) and low nitrate on wet days in the spring of 2019 (following a wet year).
After making these adjustments, the downward trend in the Cedar River looks much smaller (0.53 mg/L per year, adjusted to 0.25) and is overtaken by the Turkey River (0.37 mg/L, adjusted to 0.28). The adjusted trends are statistically significant and could be attributed to conservation efforts in those watersheds.
How did I do this? For technical details, read here.
However, there’s still some weather-related patterns we haven’t accounted for. The Raccoon River near Jefferson also had a steep decline in nitrate since 2013 (1.42 mg/L per year, adjusted to 0.77 mg/L per year) but if you look at the entire record (going back to 2008), it’s part of an up-and-down cycle. I’ve seen that same pattern in the South Skunk River. The model explains some of those swings but doesn’t fully explain high nitrate in fall of 2014, spring of 2015 and spring of 2016. Perhaps the nitrogen that accumulated in the soil during the drought of 2012 took several years to flush out.
In addition to streamflow and last year’s weather (antecedent moisture is the technical term), nitrate can be explained by season, soybean acreage, and baseflow. If it’s not enough to know that water quality is improving or getting worse, and you’d also like to know why, then let’s peel that onion!

