Abstract
Drinking water is a major source of dietary fluoride intake in communities with water fluoridation. We examined the association between urinary fluoride adjusted for specific gravity (UFSG) and tap water fluoride levels, by age and sex, among individuals living in Canada. Participants included 1629 individuals aged 3 to 79 years from Cycle 3 (2012–2013) of the Canadian Health Measures Survey. We used multiple linear regression to estimate unique associations of tap water fluoride levels, age, sex, ethnicity, body mass index (BMI), use of fluoride-containing dental products, smoking in the home, and tea consumption with UFSG. UFSG concentration was significantly higher among participants who received fluoridated drinking water (mean = 1.06 mg/L, standard deviation = 0.83) than among those who did not (M = 0.58 mg/L, SD = 0.47), p < 0.01. UFSG increased over adulthood (ages 19 to 79). Higher UFSG concentration was associated with being female, tea drinking, and smoking in the home. In conclusion, community water fluoridation is a major source of contemporary fluoride exposure for Canadians. Lifestyle factors including tea consumption, as well as demographic variables such as age and sex, also predict urinary fluoride level, and are therefore important factors when interpreting population-based fluoride biomonitoring data.
Supplementary Material
-
- Supplementary File 1: ZIP-Document (ZIP, 15 KiB)
*The full-text article is online at https://www.mdpi.com/1660-4601/18/12/6203/htm
Excerpt:
3. Results
3.1. Population Characteristics
The study sample had an approximately equal proportion of males (49%) and females (51%). The mean age was 32 years old, 73% were white, and 50% of the sample reported a high school, trade school, or college degree, while the other 50% reported a university degree or higher. The mean household income was $87,700 (median = $73,000) and the mean BMI was 24. Most demographic variables, including sex, age, and highest household education, had less than 5% missing data; 11% of participants had missing ethnicity and 15% of participants did not report either height or weight needed to calculate BMI.
Approximately half of the participants (53%) in the analytic sample with a UFSG and tap water measurement lived in a region that adds fluoride to municipal tap water. The mean UFSG concentration for the entire sample was 0.83 mg/L (SD = 0.72, median = 0.63) and the mean water fluoride concentration was 0.29 mg/L (SD = 0.29, median = 0.12). UFSG and tap water fluoride concentrations were moderately correlated overall (r = 0.31, p < 0.05). Correlations between UFSG and tap water fluoride concentrations were of the largest magnitude for ages 12 to 18 (r = 0.35), 19 to 39 (r = 0.42), 40 to 59 (r = 0.44), and 60 to 79 (r = 0.36) compared with children aged 3 to 6 (r = 0.18) and 7 to 11 (r = 0.24) years; all p-values < 0.05.
3.2. Urinary Fluoride Levels by Demographic Characteristics
The mean and median levels of UFSG (mg/L) by sex, age, and CWF status are presented in Table 1. As expected, participants living in a fluoridated region had significantly higher UFSG than those living in a non-fluoridated region for each of the six age groups (Figure 2).
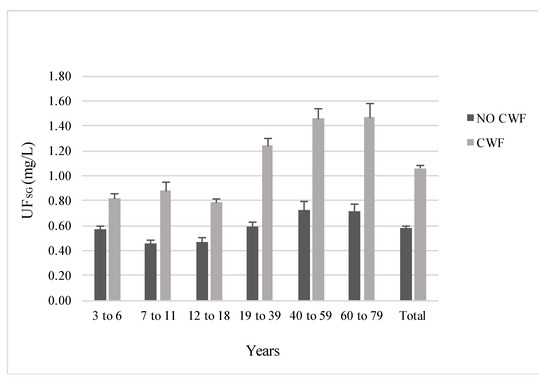
Figure 2. Mean levels of UFSG by age group and CWF status. Error bars represent the standard error of the mean.
Table 1. UFSG (mg/L) by sex, age group, and CWF status, with t-tests comparing UFSG for individuals living in fluoridated and non-fluoridated regions by age group.

When collapsed across age groups, UFSG concentration was 82% higher among participants who received fluoridated drinking water (M = 1.06 mg/L, SD = 0.83) than among those who did not (M = 0.58 mg/L, SD = 0.47), t = -13.7, p < 0.01. Females had higher UFSG levels than males across all age groups (Table 1; Figure 3), though the differences were only significant for females aged 60 to 79 (females: M = 1.16 mg/L, SD = 1.00; males: M = 0.94 mg/L, SD = 0.97), t = -2.0, p = 0.039. Collapsing across age and CWF status, females had significantly higher UFSG concentration (M = 0.89 mg/L, SD = 0.76) than males (M = 0.77 mg/L, SD = 0.67), t = -3.4, p < 0.01.
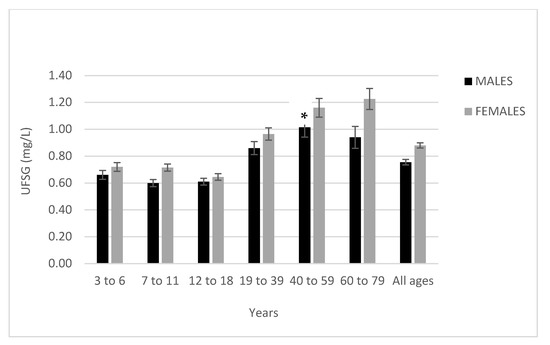
Figure 3. Mean UFSG levels by age group and sex. Error bars represent the standard error of the mean. * Depicts significant difference between males and females (p < 0.05).
Females aged 60 to 79 living in fluoridated regions had the highest level of UFSG at 1.56 mg/L, followed by females aged 40 to 59 at 1.51 mg/L. Males aged 7 to 18 living in non-fluoridated regions had the lowest levels of UFSG at 0.43 mg/L.
3.3. Differences in UFSG by Drinking Water Habits
In fluoridated regions, UFSG concentration was significantly higher among participants who report drinking primarily tap water (M = 1.09 mg/L, SD = 0.86) than among those who report drinking primarily bottled water (M = 0.95 mg/L, SD = 0.67), t = 2.06, p = 0.04. In non-fluoridated regions, UFSG concentration was similar among participants who report drinking primarily tap water (M = 0.58 mg/L, SD = 0.48) compared with those who report drinking primarily bottled water (M = 0.56 mg/L, SD = 0.39), t = 0.72, p = 0.47. In fluoridated regions, nearly all participants reported receiving municipal tap water and very few reported using a private well (t-tests for this comparison were not permitted due to Statistics Canada sample size requirements for data release). In non-fluoridated regions, UFSG concentration was significantly higher among participants who received their water from a private well (M = 0.73 mg/L, SD = 0.57) than among those who received municipal tap water (M = 0.54 mg/L, SD = 0.43), t = ?3.53, p < 0.01.